Uplift modeling is supposed to do something response modeling can't. Instead of finding people who are likely to buy, it tries to find people who buy because of the ad, and skip the ones who'd have bought anyway. It's a real distinction, and I wanted to see how well it holds up in practice, so I went looking for a dataset built to test exactly this: about 14 million users from real randomized ad experiments, published by Criteo's research lab. A random slice of users was held back from ads entirely, which means I could compare the two groups directly instead of guessing at who was comparable to whom.
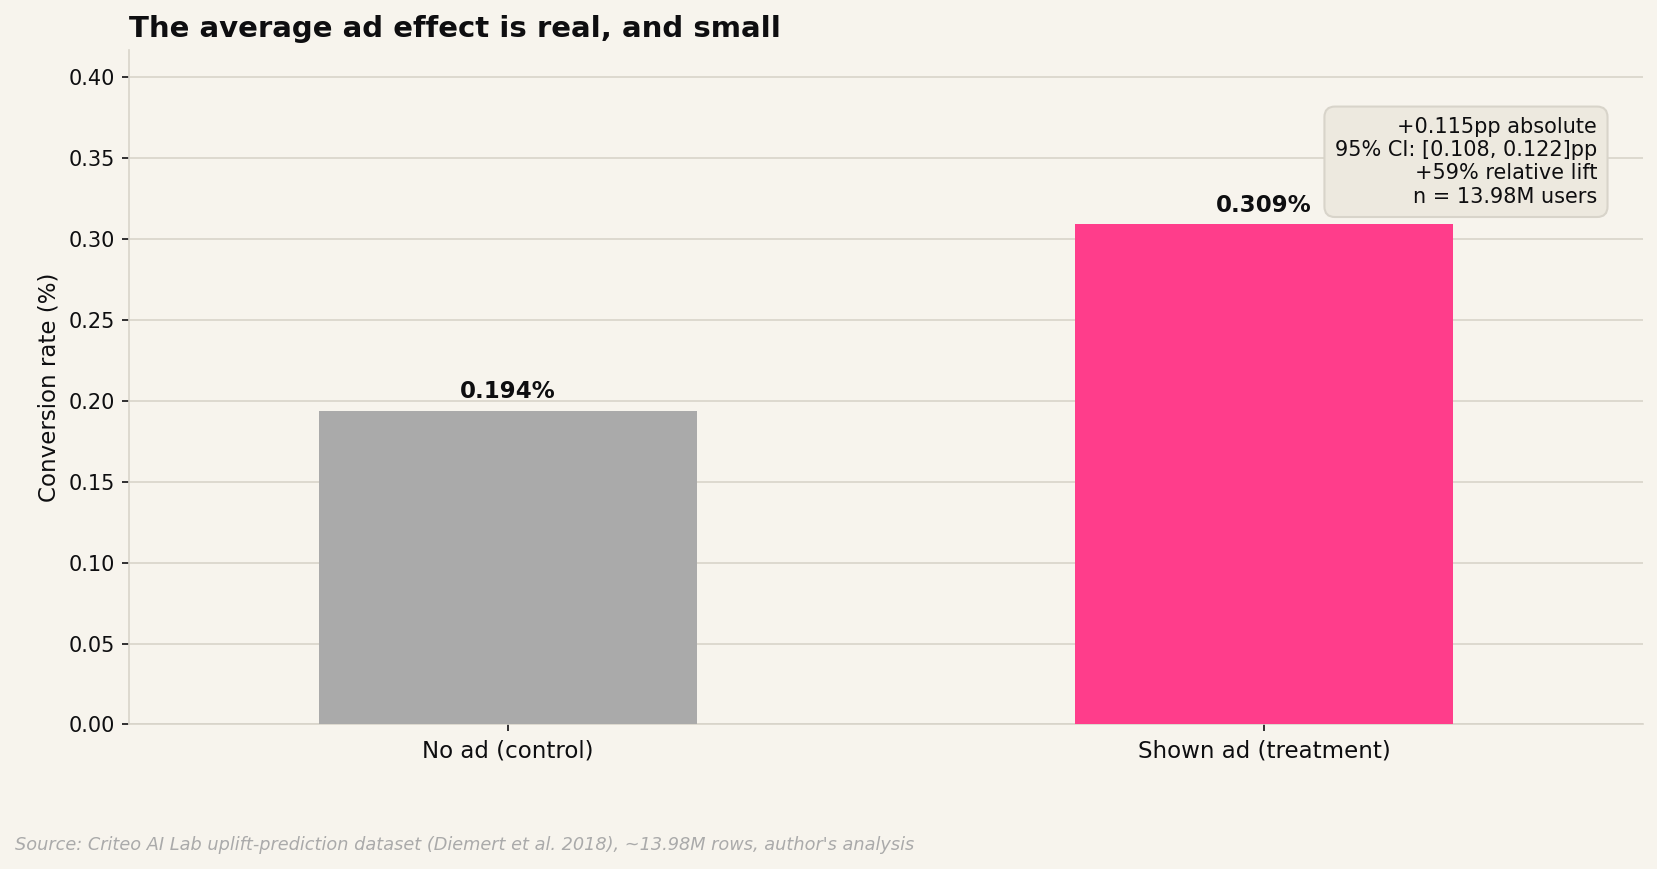
The average effect is there, and it's small. Conversion rate was 0.194% among people who didn't see the ad and 0.309% among people who did, a gap of 0.115 percentage points (95% CI [0.108, 0.122]). That's a 59% relative lift on a very small base. Visit rate moved less in relative terms, from 3.82% to 4.85%. With 14 million users both numbers come out precise, even though the underlying effect is modest. What they don't tell you is whether that lift is spread evenly across users or concentrated in a smaller group.
That's what uplift modeling tries to answer. The standard setup, a two-model approach, trains one model on people who saw ads and a second on people who didn't, then subtracts the two predictions to get an estimated uplift for each person. I built that on this data, held out a third of it to test on, and scored the ranking with a Qini curve, which is roughly how this literature checks its own work: rank users by predicted uplift and see how many incremental conversions you capture moving down the list.
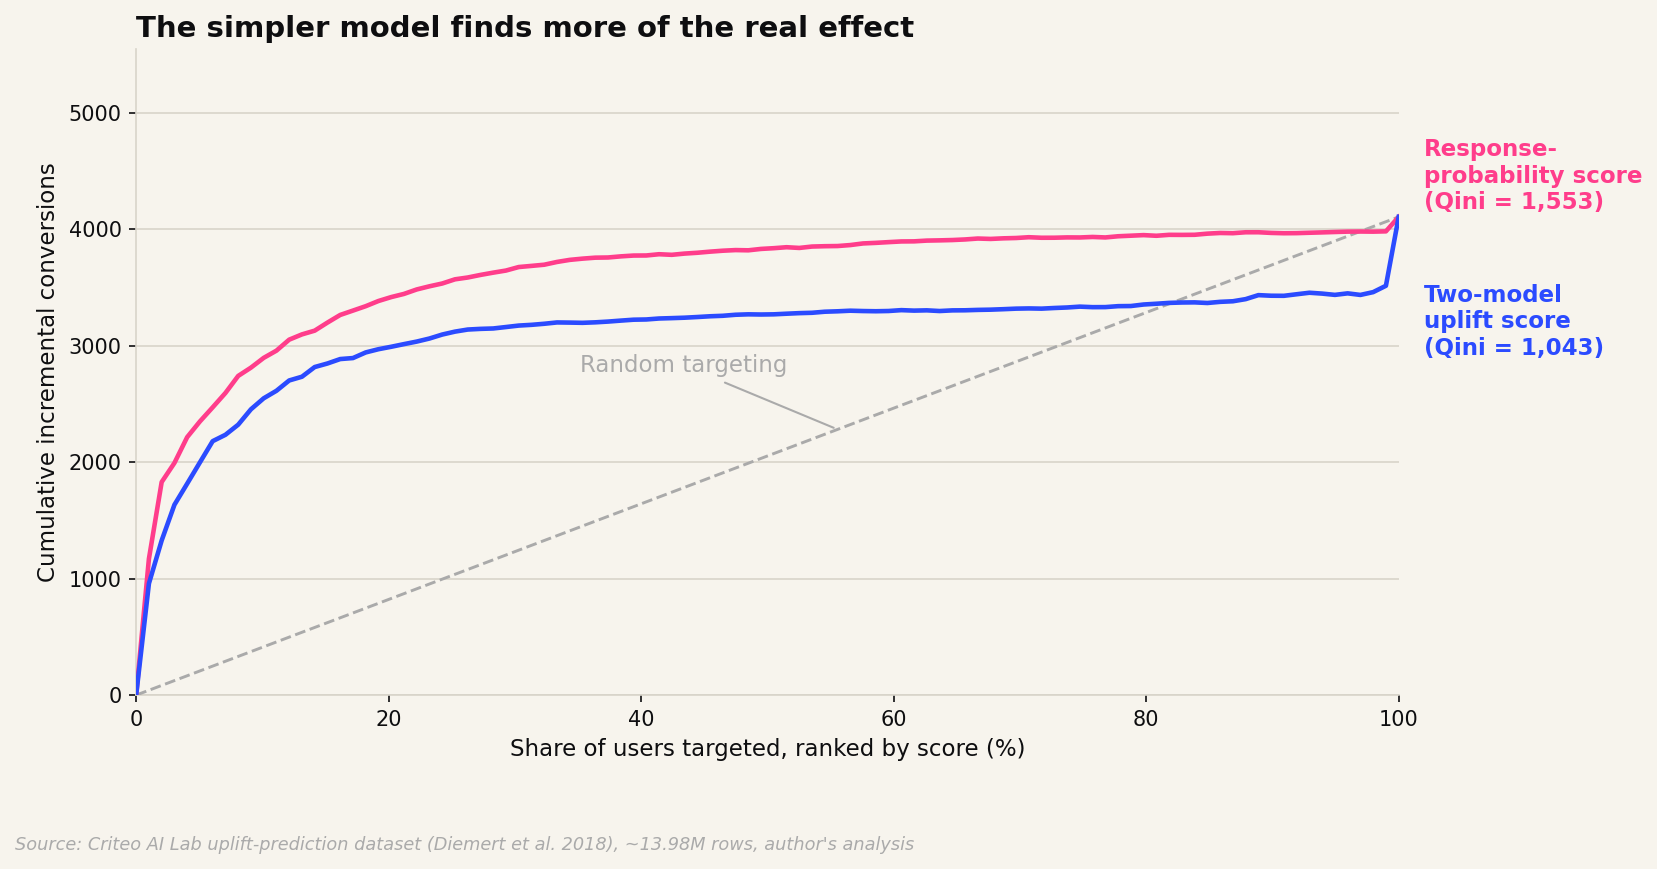
Both the uplift score and a much simpler baseline, a single model that just predicts who's likely to convert if shown an ad, beat random targeting by a wide margin. But on this dataset, the two-model uplift score came in a bit behind the plain one: a Qini coefficient of 1,043 versus 1,553. That surprised me, since the two-model setup exists specifically to do better than plain response prediction.
The likely reason is fairly mundane. The control-side model has to predict conversions among people who saw no ad at all, where the base rate is under 0.2%, and there isn't much for it to learn from twelve anonymized features at that rate.
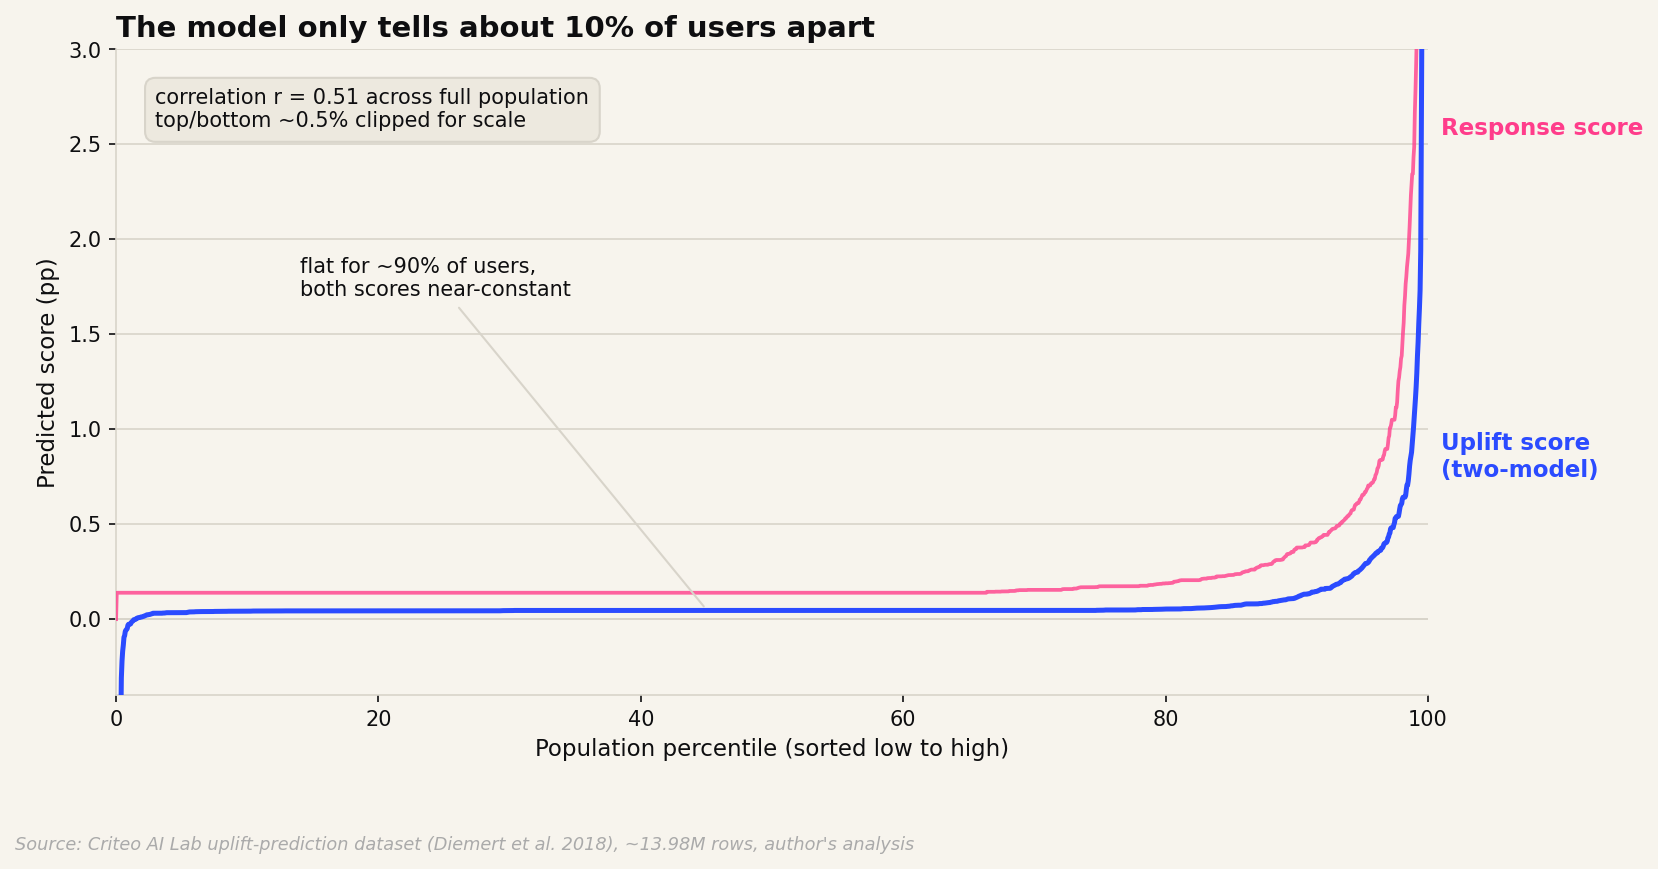
Sorted by percentile, both scores are nearly flat for about 90% of users, so a lot of what separates the two rankings is just noise coming from a control-side model with little to say. They end up correlated at r = 0.51, and the top 10% by each ranking overlap 88%. Mostly the same people, with some extra noise mixed in from the subtraction.
There is real signal somewhere, though. Breaking the test set into deciles by predicted uplift, most of the middle bounces around zero, but the top decile shows a genuine 0.70-point incremental lift, about six times the average and well outside noise.
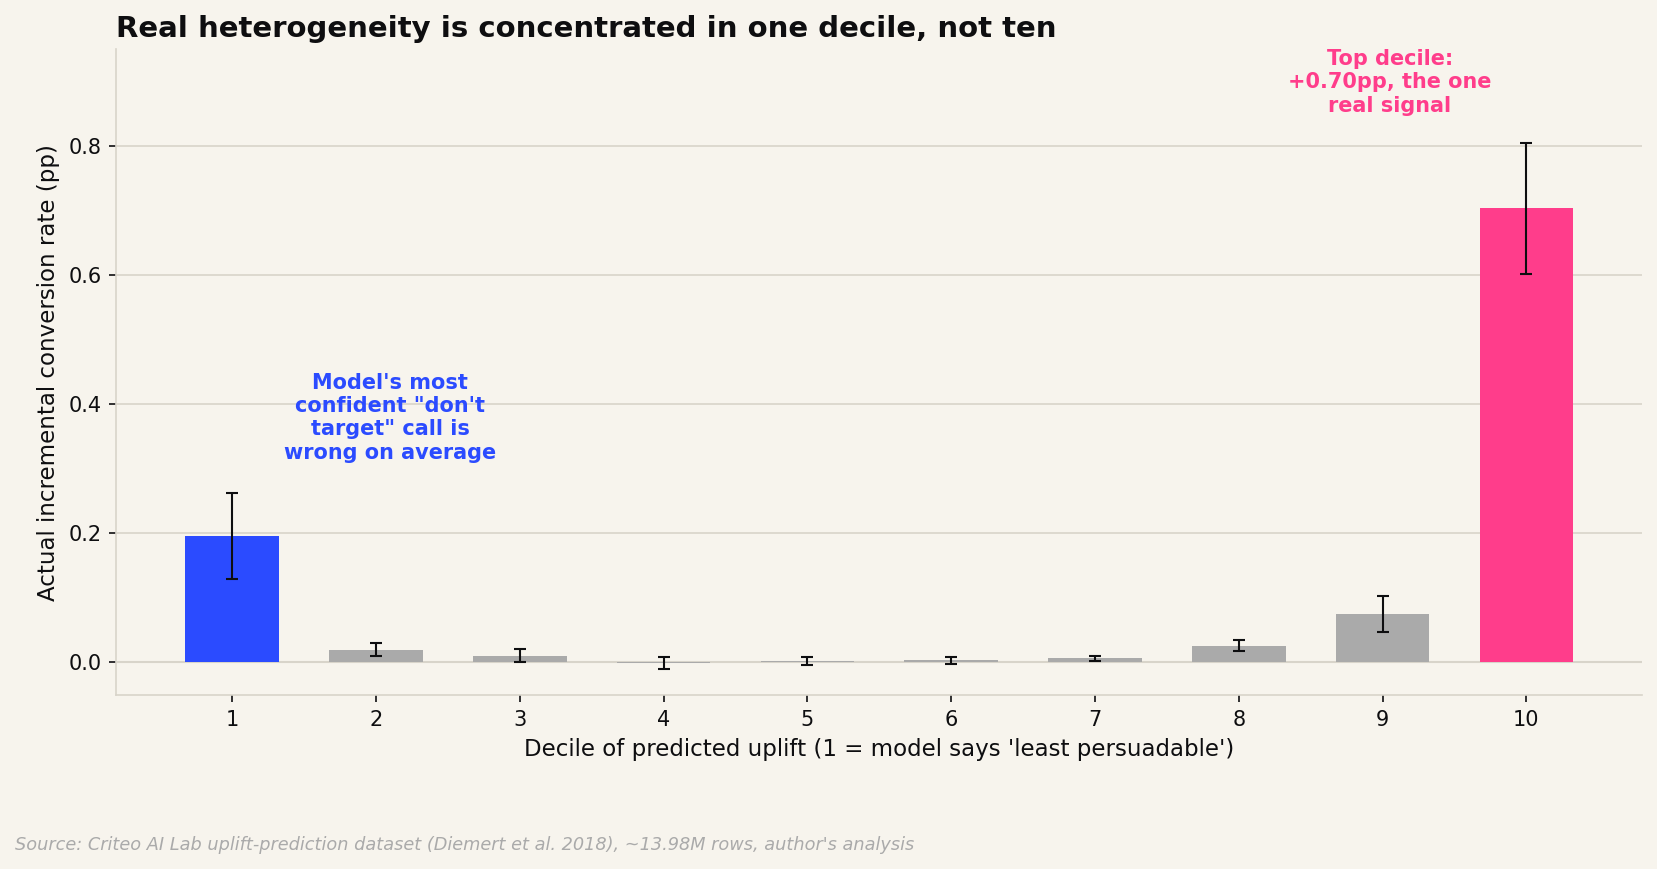
That top slice alone accounts for something like two-thirds of the total incremental conversions. What's odd is the bottom decile, the group the model is most confident about excluding, which also shows a real, positive effect, second only to the top group. So it's not weak signal everywhere. It's real signal at the top and a genuine miss at the bottom.
Worth being clear that this is the standard, textbook version of uplift modeling, not the most careful one available. Methods like causal forests and the X-learner exist specifically to handle a noisy control arm better than a plain two-model split does, and the paper behind this dataset reports similarly modest gains from uplift approaches on it. None of this says uplift modeling can't work. It says the default version of it takes real care to beat a much simpler model, and isn't something to trust blindly, especially the part where it tells you who to leave out.