On July 3, close to $49 million traded on Polymarket over a single group-stage match between Argentina and Cape Verde. Right before kickoff, the market had Argentina at 86.5% to win outright, Cape Verde barely registering, a draw a distant third. The match ended in a draw. Not an Argentina win with a late equalizer taken back, an actual 0-0-style stalemate the market had priced at around 10%. It was one of the most confidently wrong prices on the biggest match of the tournament to that point.
One bad price on one glamour match isn't a finding, it's an anecdote. But it turns out to be the pattern rather than the exception. Prediction-market theory, going back to Wilson and Milgrom's work on information aggregation, says a market's price should get more accurate as more people trade it, because each new participant adds a little more independent information to the pool. I pulled pre-kickoff implied probabilities and resolved outcomes for every FIFA World Cup 2026 match on Polymarket, then checked whether that held. It didn't. The matches that attracted the most money had the worst-calibrated odds of the tournament, and how many distinct people were trading barely mattered at all.
A market's implied probability is calibrated if, across all the times it says "70%," the thing happens about 70% of the time. The standard way to score that is the Brier score, the squared distance between the probability a market quoted and the 0-or-1 outcome that actually happened, averaged across matches. Lower is better; a market that says 100% and is right scores 0, a market that says 100% and is wrong scores 1.
Polymarket runs each World Cup match as three separate yes/no markets, home win, draw, away win, each with its own order book and its own price history. I pulled pre-kickoff prices, resolved outcomes, total volume, and unique trading wallets for every match, via Polymarket's Gamma and CLOB APIs. The CLOB's price history only retains about 30 days of ticks, a rolling window that drops the tournament's earliest matches as it moves forward, an artifact of the API rather than the market. That leaves 73 matches as of this week, group stage through the semifinals (Spain beat France, Argentina beat England) and Saturday's third-place match between the two semifinal losers, France and England (England won). The final, Spain against Argentina, is being played as this goes out and isn't in the sample yet.
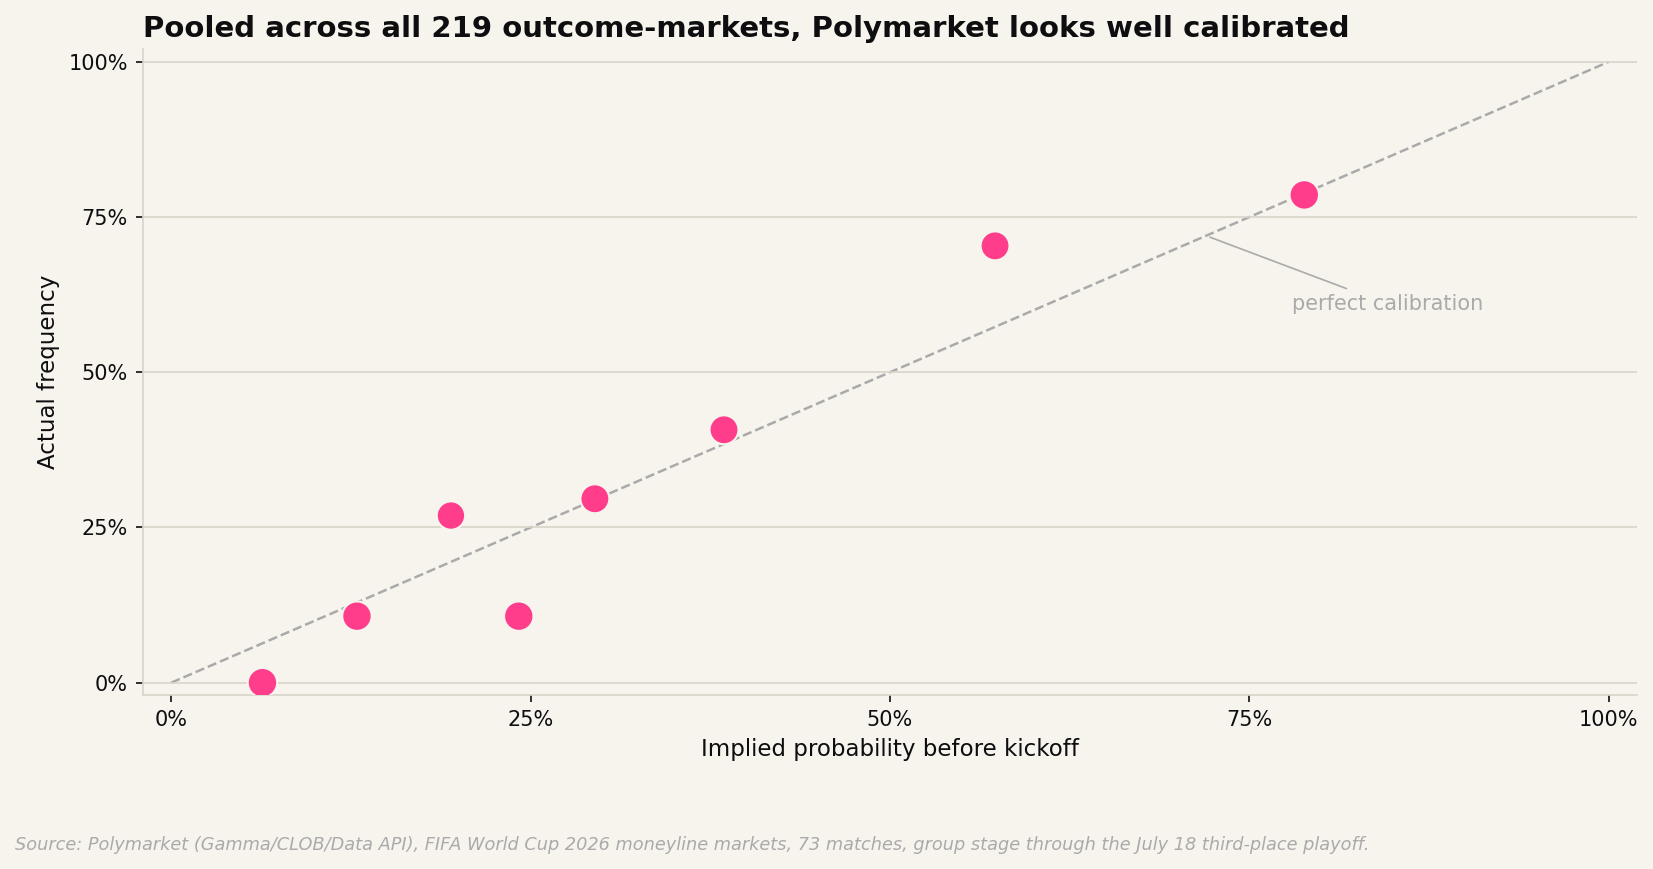
Pooled across all three-way markets, Polymarket's prices track the 45-degree line reasonably well. Outcomes priced around 20% happen around 20% of the time, ones priced around 75% happen close to 75% of the time. On the surface, this looks like a market doing its job. That average is hiding the more interesting result underneath it.
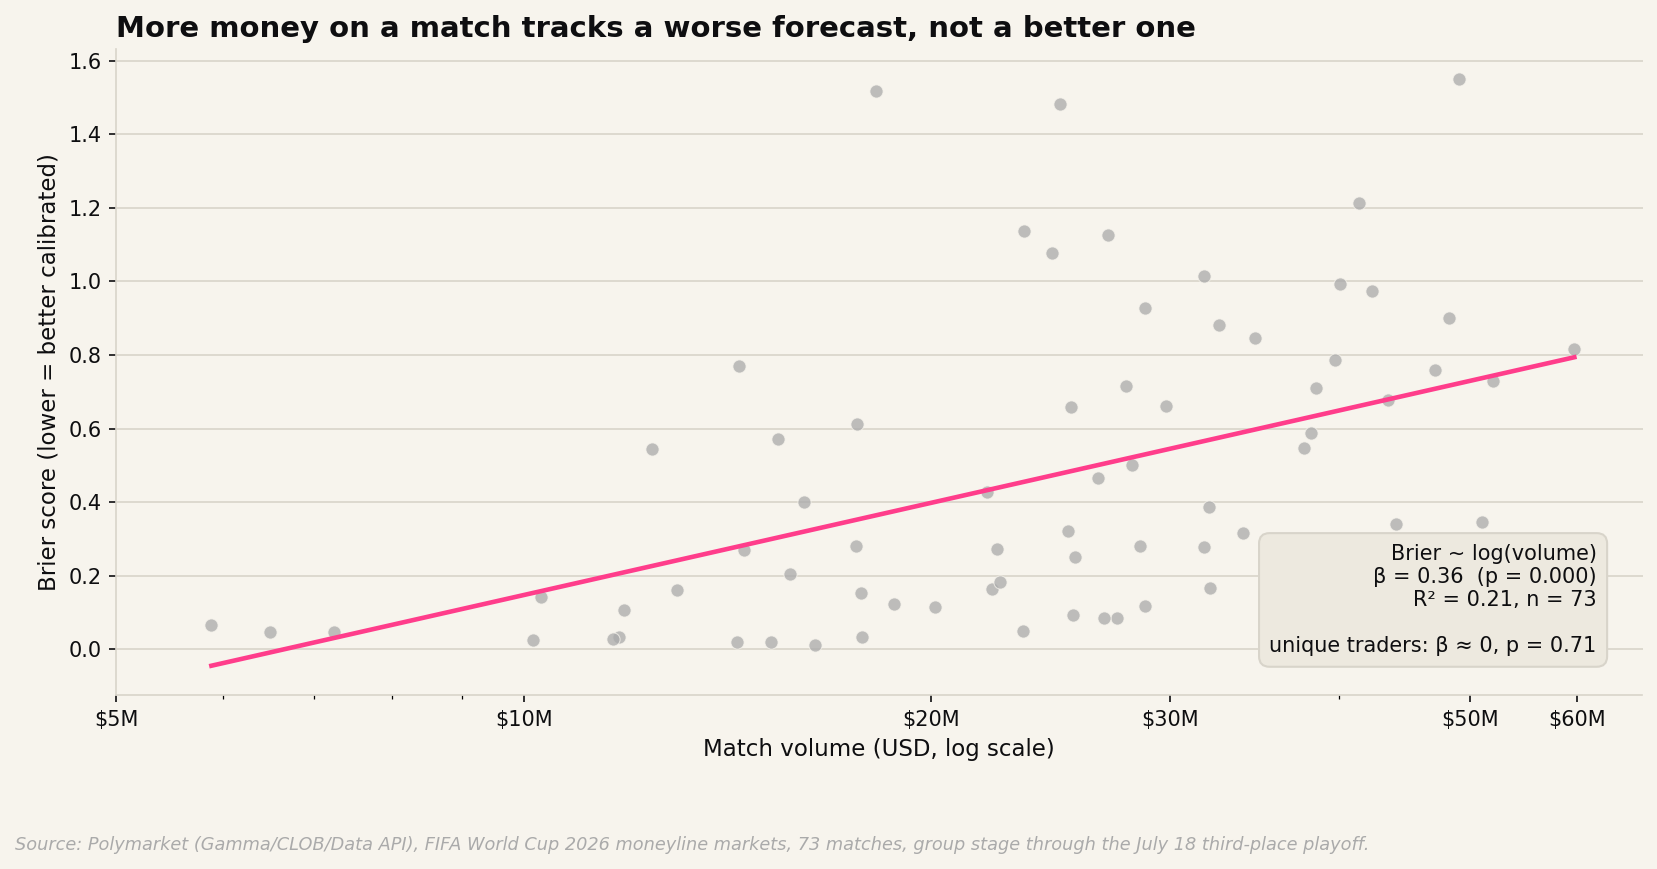
Regressing each match's Brier score on the log of its trading volume gives a coefficient of 0.36, reliably positive (p < 0.001), meaning a match with ten times the money changing hands scores meaningfully worse on calibration, not better. It isn't just a proxy for how close the match looked going in either: controlling for how lopsided the pre-kickoff favorite was and for group-stage-versus-knockout stage, the volume coefficient barely moves.
Unique trading wallets, on the other hand, predict nothing. Regressed against Brier score on its own, the coefficient on trader count is statistically indistinguishable from zero (p = 0.73). That separation matters: it isn't that more people trading makes the market worse, since more people has no measurable effect either way. It's specifically that more dollars, concentrated or not, track worse calibration.
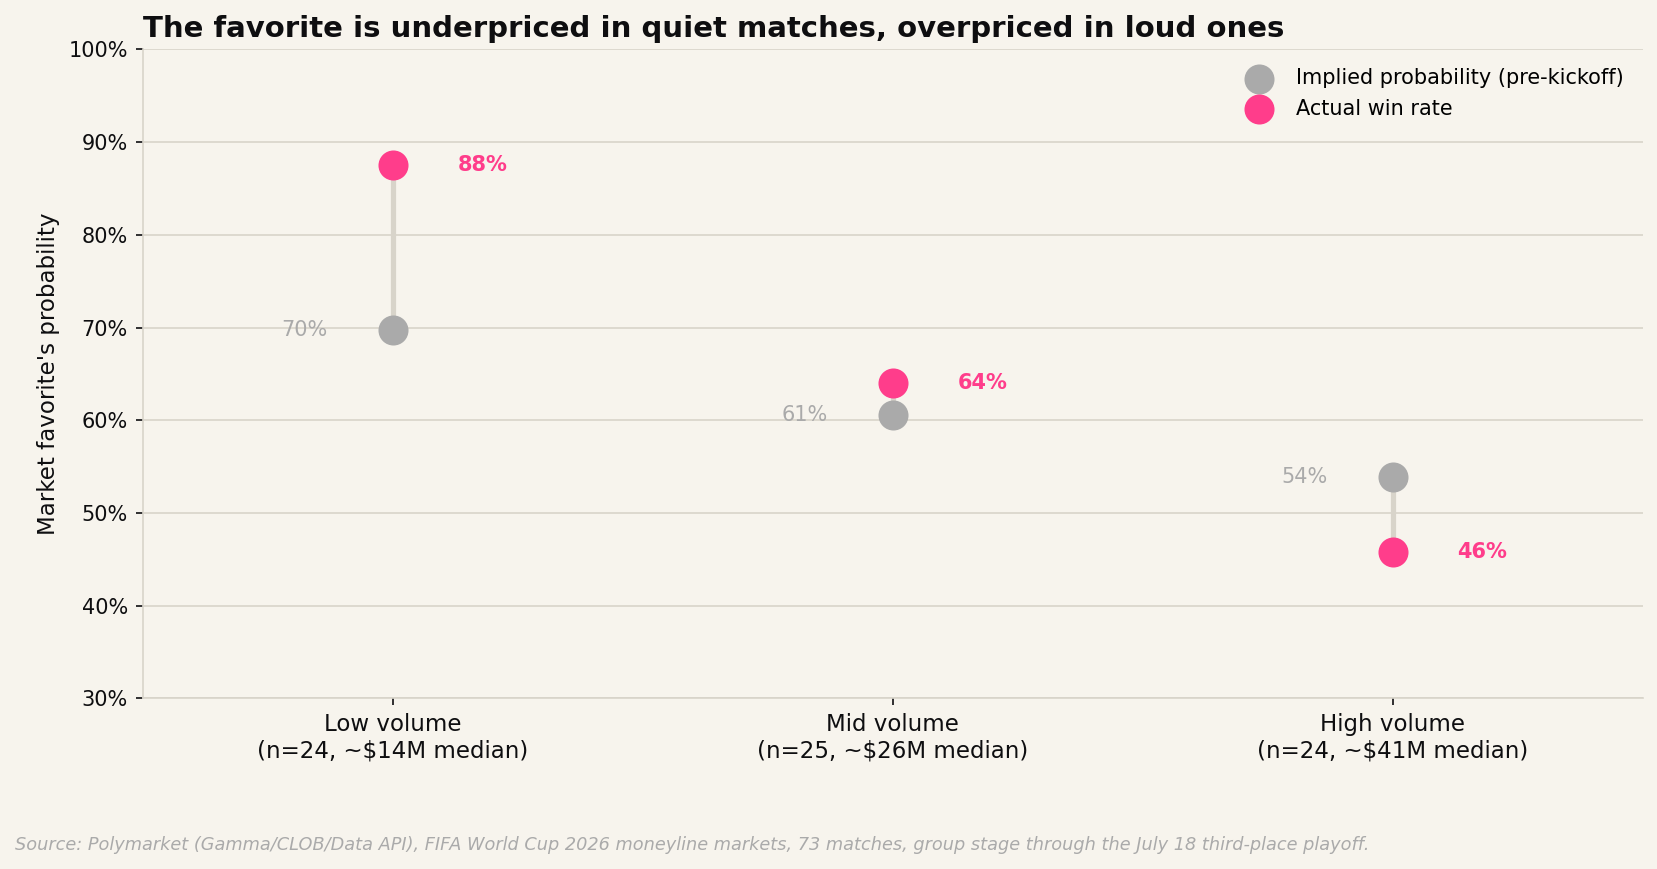
Splitting matches into volume tertiles shows where that comes from. In the quietest third of matches, a median of about $14 million traded, the market's favorite was priced at 70% and actually won 88% of the time, underpriced. In the loudest third, a median of about $41 million traded, the favorite was priced at 54% and won only 46% of the time, overpriced. The bias doesn't just get bigger with volume, it flips sign. Cheap, overlooked matches get a favorite the market doesn't trust enough. Expensive, watched matches get a favorite the market trusts too much.
The Wilson-Milgrom result that more participants improve a market's price assumes those participants bring independent signal, not correlated opinion. A World Cup match between Argentina and a team most bettors couldn't place on a map draws a specific kind of extra money when it hits Polymarket's front page: fans, not forecasters, backing a name they recognize. That's a plausible account of why volume and calibration move in opposite directions here, though it's a story I'm inferring from the pattern rather than one I can prove from wallet-level data alone; nothing here identifies who any given trader is or why they placed a bet.
Two things complicate a clean reading. Team quality and popularity are correlated by construction, the teams that draw casual money, Argentina, Brazil, England, France, are also genuinely good teams, so some of what looks like sentiment-driven overpricing could instead be a market that's simply too confident in strong teams specifically, for reasons unrelated to fandom. And group-versus-knockout stage moves with volume too, later, higher-stakes matches draw more trading and also involve teams that survived elimination, a form of skill; the regression's control for stage doesn't fully rule out that stronger competition, not sentiment, is doing some of the work.
Neither undercuts the basic asymmetry. A market's accuracy isn't a simple function of its size, and treating "more liquidity" as a proxy for "more trustworthy price" breaks down exactly where it matters most, on the biggest, most-watched events. The same open question shows up in other places money and attention spike together: retail media auction data isn't public in the way Polymarket's is, but the pattern where CPCs and conversion quality move in opposite directions during a platform's highest-traffic windows, holiday shopping events being the obvious example, would be consistent with the same mechanism, extra participation that's correlated rather than independent, though it's not something this dataset can test directly. Scale isn't the same thing as information. Sometimes it's just more of the same opinion, priced in twice.
Data: Polymarket Gamma, CLOB, and Data APIs, FIFA World Cup 2026 moneyline markets (home win / draw / away win), pulled July 19, 2026, group stage through the July 18 third-place playoff. N = 73 matches with complete pre-kickoff price history (30 earlier matches were excluded because they fall outside the CLOB API's rolling ~30-day price-history retention window). Brier scores computed per match across all three outcomes; volume and resolved outcomes from Gamma event metadata; unique trading wallets from the Data API's trade-level records, capped at 10,000 trades per market by the API. Code available on request.