In 2023/24, Jude Bellingham arrived at Real Madrid and scored 18 non-penalty goals in his debut season, from shots worth about 12 expected. It was one of the most sensational debut seasons a Real Madrid signing has had this century, and it came with the usual storyline attached: he'd arrived a finished product, a generational talent operating on a different level. The next season he scored 8 from shots worth almost exactly the same 12 expected. The positions he was getting into hadn't really changed. What dried up was whether the shots went in, a much less interesting explanation than the one that made the rounds.
Bellingham isn't a special case, he's close to the norm. My argument is that a striker's finishing output, goals scored relative to the shots he takes, carries almost no information from one season to the next, while the rate at which he gets into good scoring positions in the first place is one of the most stable numbers in football. If that sounds like a niche football-stats point, it's actually the exact mistake measurement teams fight every day in a much more expensive setting: crediting a campaign for a metric bounce that was already reverting to baseline, or a rep's best quarter to a new pitch instead of a lucky patch of easy deals. A striker's goal count is a noisy outcome metric. The shots he takes are the closest thing football has to a model-adjusted baseline, and the baseline is what should get trusted.
Expected goals (xG) scores every shot by how often shots like it, from that distance, angle, and situation, go in, based on hundreds of thousands of prior shots. A player's non-penalty xG in a season measures the chances he got. His actual non-penalty goals is xG plus finishing luck: deflections, a goalkeeper's form that week, the width of a post. The question is how much of that luck component sticks around into the next season.
I pulled player-season data from Understat for the six European leagues with public xG coverage (Premier League, La Liga, Bundesliga, Serie A, Ligue 1, Russian Premier League), 2014/15 through 2023/24, restricted to players with at least 900 minutes in both of two consecutive seasons and a real shooting workload (at least 0.05 xG per 90 in both seasons, to exclude defenders and defensive midfielders who clear the minutes bar but barely shoot). That gives 5,498 player-season pairs.
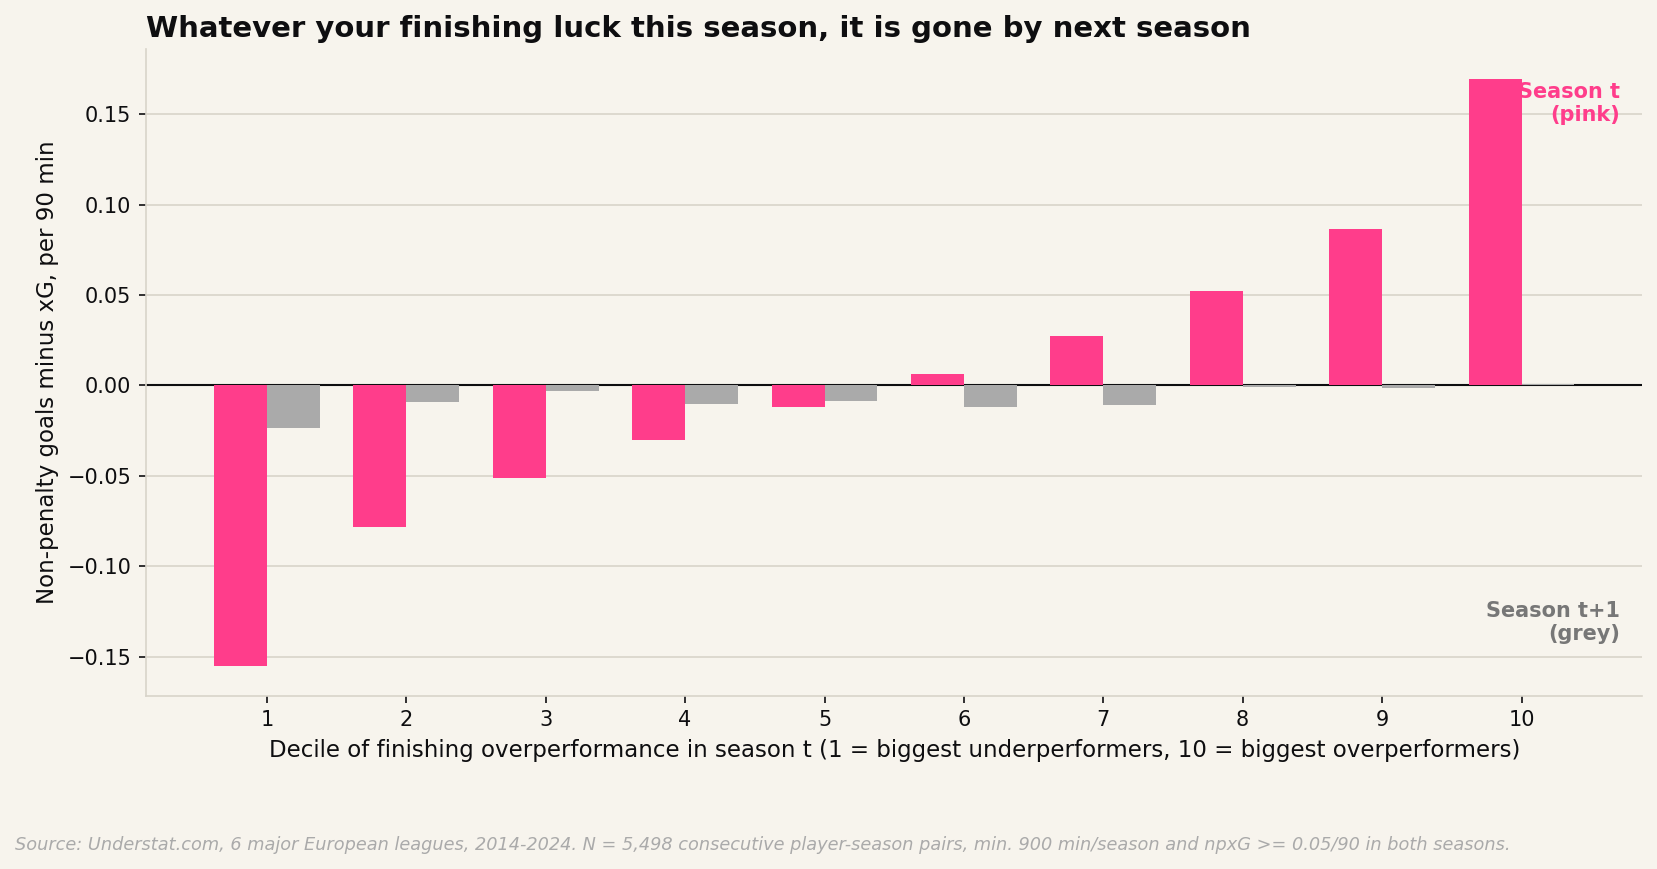
Sort players into deciles by how far above or below their own xG they finished in a given season, and the picture is close to symmetric collapse. The bottom decile undershot their xG by 0.16 non-penalty goals per 90 minutes; the next season, that gap closes to 0.02. The top decile overshot by 0.17 per 90; the next season, 0.001. Whatever separated the best finishers of a given year from the worst, almost none of it was still there twelve months later.
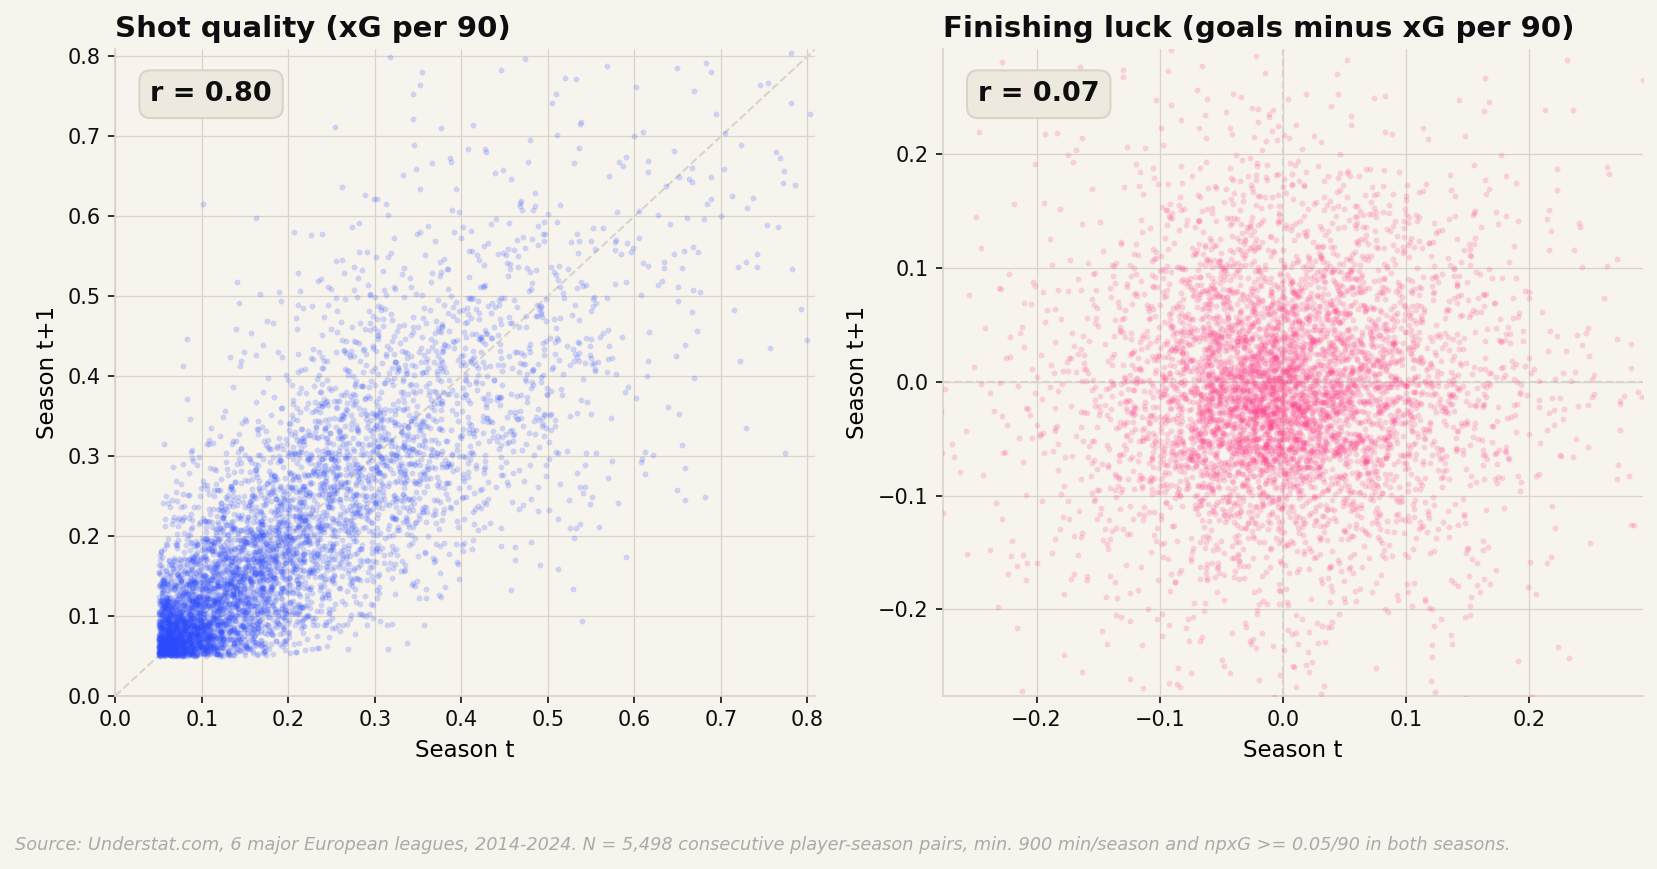
The contrast is starkest side by side. A player's xG per 90 in one season correlates with his xG per 90 the next at r = 0.80, tight enough that the chances a player gets are close to a fixed trait of his role and ability. His finishing overperformance, goals minus xG, correlates at r = 0.07, indistinguishable from zero at this sample size. The shots a player takes are a real, fairly fixed part of his game. Whether they go in beyond what those shots deserve is close to a coin flip from one year to the next.
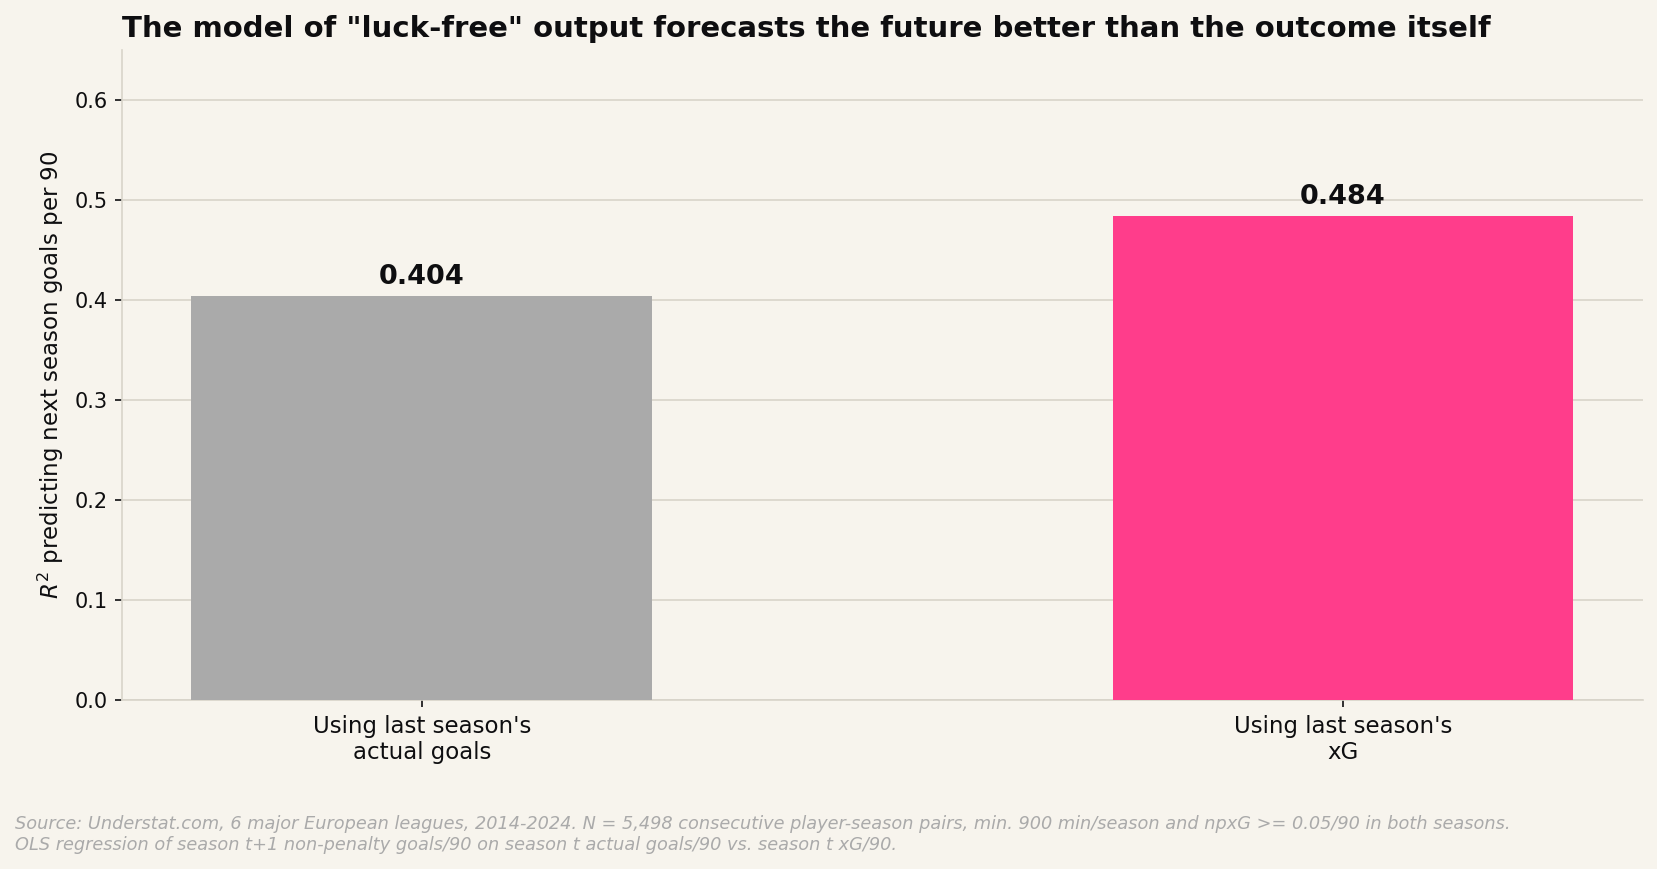
Put those two facts together and something a little uncomfortable follows: a player's actual goals this season are a worse predictor of his actual goals next season than his xG is. Regressing next season's non-penalty goals per 90 on this season's actual goals gives an R² of 0.404. Using this season's xG instead of actual goals raises it to 0.484. The model of what a player's output should have been beats the record of what it was at forecasting what it will be, because the record includes a chunk of noise the model already strips out.
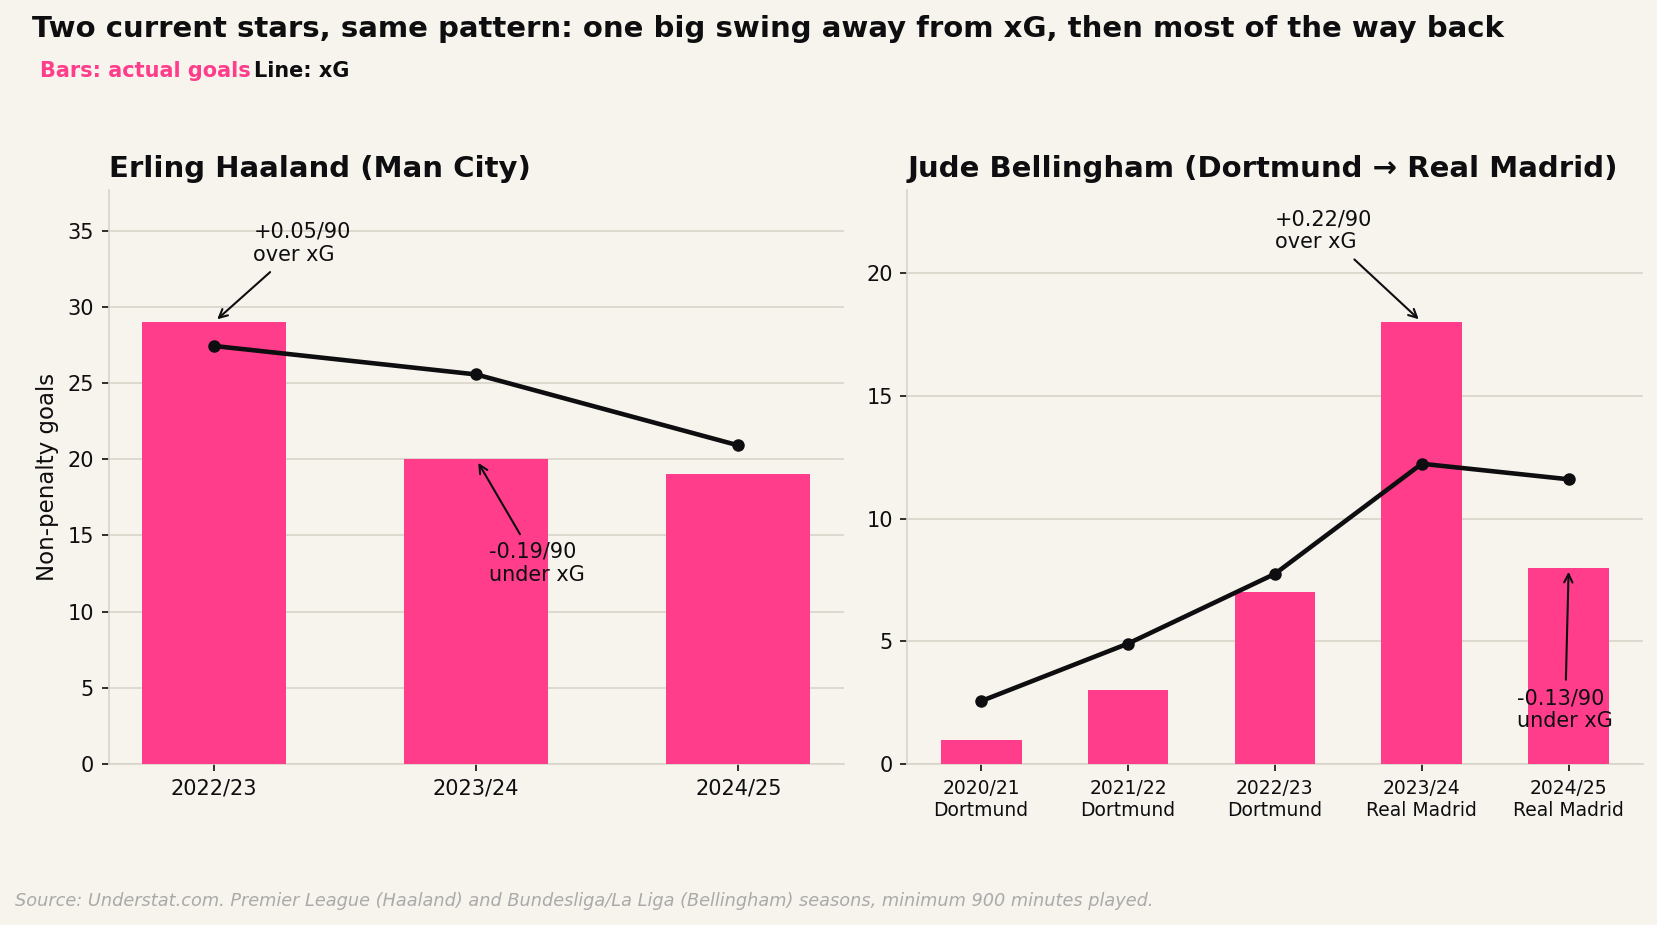
Two current, extremely online examples make the same point in miniature. Erling Haaland overshot his own xG by 0.05 non-penalty goals per 90 in his first Manchester City season; the next year he undershot it by 0.19, and only clawed back to -0.06 the year after. Jude Bellingham's Real Madrid debut outran his xG by 0.22 per 90; the very next season he was back underneath it. Neither swing needed an injury, a tactical shift, or a manager losing faith in them. It just needed another season to happen.
A courtesy disclaimer, since somebody will ask: none of this applies to Lionel Messi. Across nine tracked seasons at Barcelona and Paris Saint-Germain he outscored his own xG in seven of them, averaging +0.11 non-penalty goals per 90 above expected for his career. Everyone else in this sample reverts toward zero eventually. Messi appears to have been issued an exemption.
Two things complicate a clean "it's all luck" reading. Transfers, managerial changes, and aging can genuinely shift a player's role and the quality of service he gets between seasons, and some of what looks like reversion is really a change in the underlying game, not noise correcting itself; the fact that npxG itself only correlates at 0.80 rather than 1.0 year over year means real change is happening, just mostly on the chance-creation side rather than the finishing side. And the 900-minute cutoff in both seasons introduces a selection effect: a player who finishes far enough below his xG can lose his starting role before he gets the chance to recover in the data, which means the bottom-decile recovery in the first chart is probably a floor on how much reversion actually happens, not the full picture.
Neither caveat touches the core asymmetry, and it generalizes past football. Any time an outcome metric is a mix of a stable process and genuine noise, the outcome will look more dramatic than the process, and whoever built the mixture will always look temporarily brilliant or temporarily cursed right before they revert. The chances a player gets are the estimate. The goals are the estimate plus static, and static is not a skill.
Data: Understat.com, non-penalty goals and expected goals by player-season, six major European leagues (EPL, La Liga, Bundesliga, Serie A, Ligue 1, RFPL), 2014/15-2023/24. N = 5,498 consecutive player-season pairs, minimum 900 minutes played and at least 0.05 xG per 90 in both seasons of each pair. Code available on request.