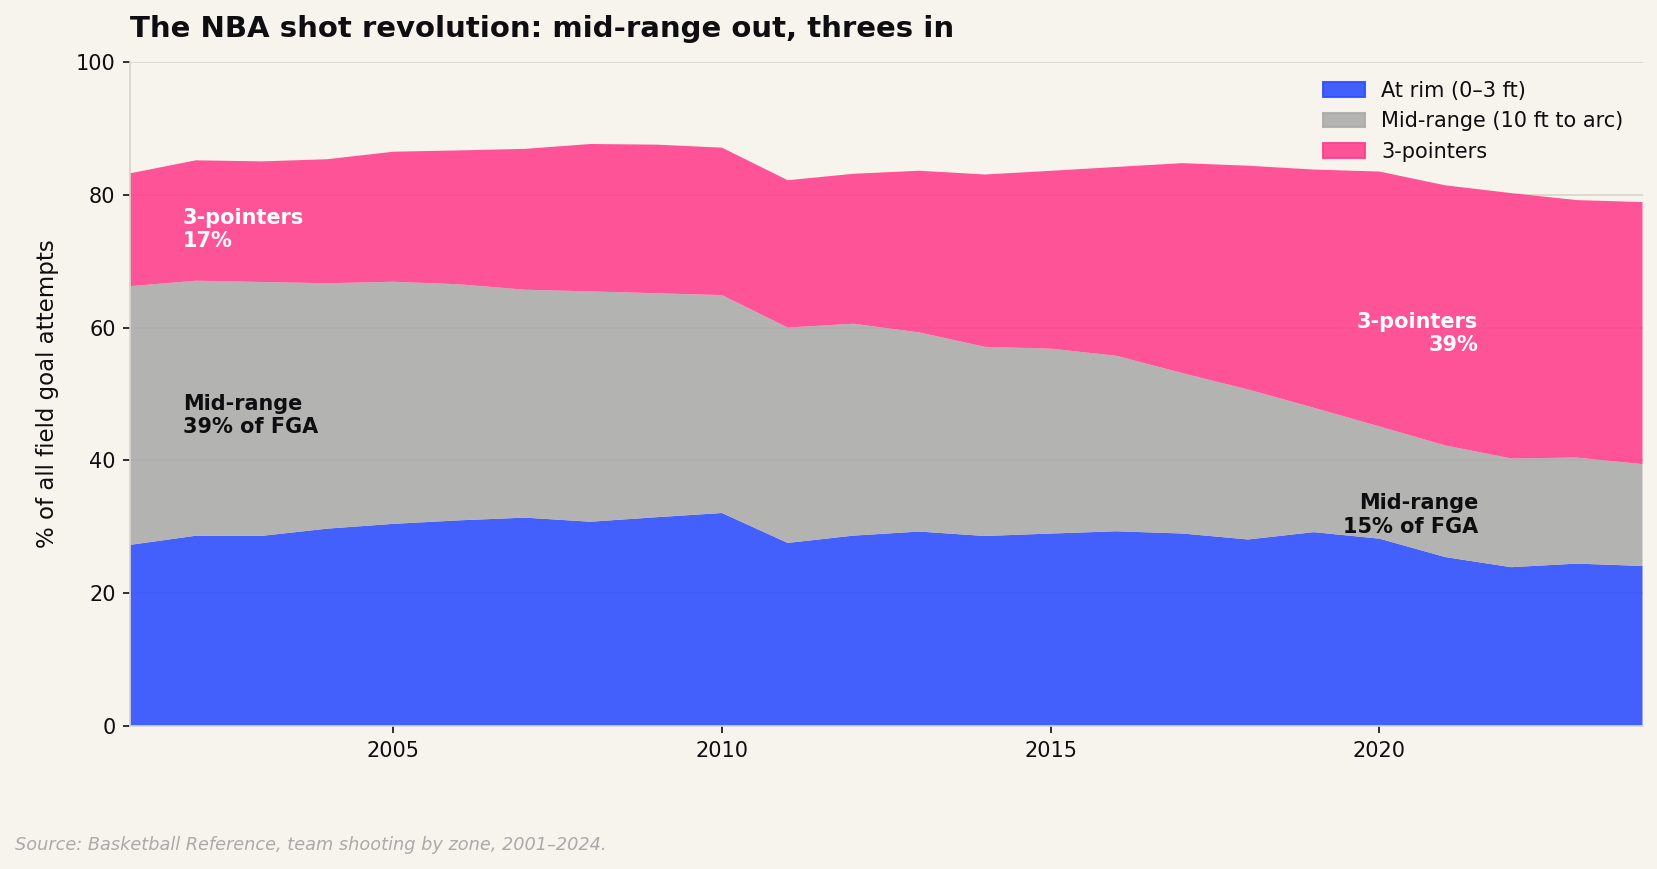
Mid-range shots fell from 39% of NBA field goal attempts in 2001 to 15% in 2024, and yet the teams still taking them shot better from that range than at any point in that era. The most natural explanation is that players got better, or that survivors of an evolutionary filter are a self-selected group. But there is another possibility: that the defenses they faced changed, and that change made the shots easier.
My argument is that mid-range efficiency rose partly because analytically-oriented teams stopped shooting from that area, causing defenses to shift toward the three-point line and the rim, leaving the mid-range more open for everyone else. I cannot prove this from the data I have, but the mechanism is coherent, a correlation of 0.73 across 24 seasons is consistent with it, and a recent paper about A/B testing in ML systems offers a useful conceptual frame.
Teams that adopted analytics-based shot selection changed what their opponents had to defend. If you are guarding a team that almost never shoots from 15 feet, you stop committing defenders to that zone. Coverage migrates to the arc and the rim, which is where the threat actually lives. When a traditional team plays against that defense, the mid-range opens up. The analytics teams cleared the space; the holdouts walked into it without doing anything differently themselves.
A 2024 paper describes something structurally similar in online experiments with ML models. When two competing model variants train on the same data pool, they are not truly independent: one model's decisions change what data gets collected, which changes how the other model learns. An exploit-heavy model benefits from the training signal that an exploratory model generates and looks better than it would if deployed alone. The paper calls this piggybacking. The NBA version works through defense rather than training data, but the shape of the problem is the same.
To test this, I used 716 team-seasons from Basketball Reference covering 2001 through 2024, which includes zone-level shot distribution and field goal percentages for every team in every season. For each team-season I computed an analytics score, the share of shots taken at the rim (0-3 ft) or beyond the arc, and ranked teams within each season. The bottom tertile I'm calling traditional; the top tertile, analytics. Ranking within the season rather than against a fixed threshold matters because a shot distribution that looked progressive in 2005 would look conservative by 2018.
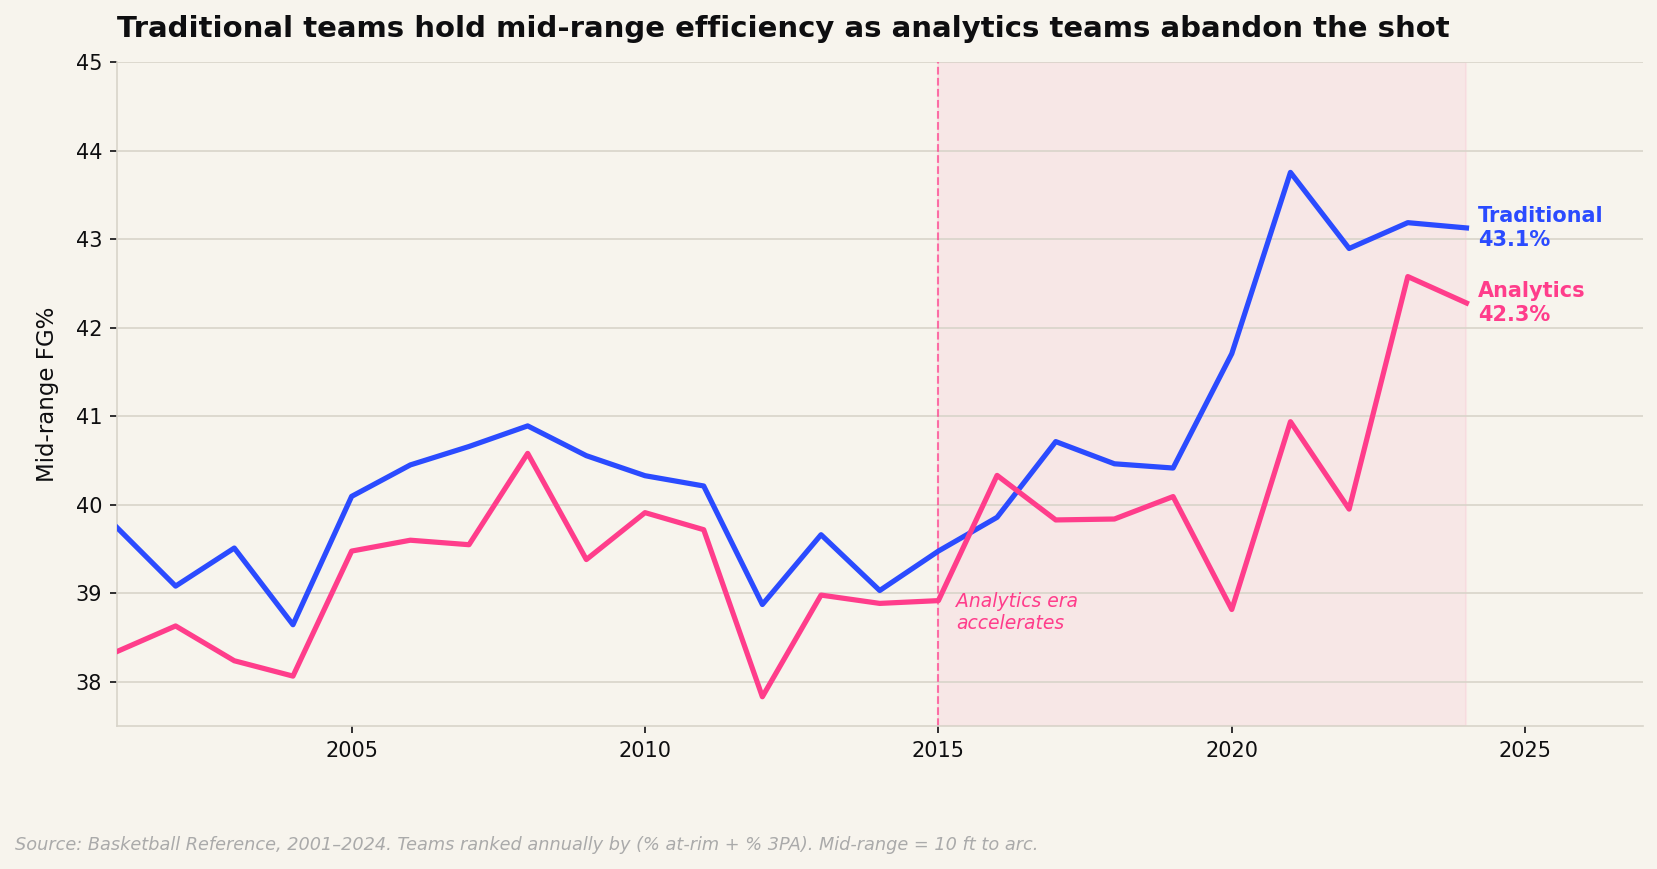
Both groups' mid-range efficiency trended up through the analytics era. Traditional teams improved more, and the gap is most visible after 2015, when league-wide adoption accelerated.
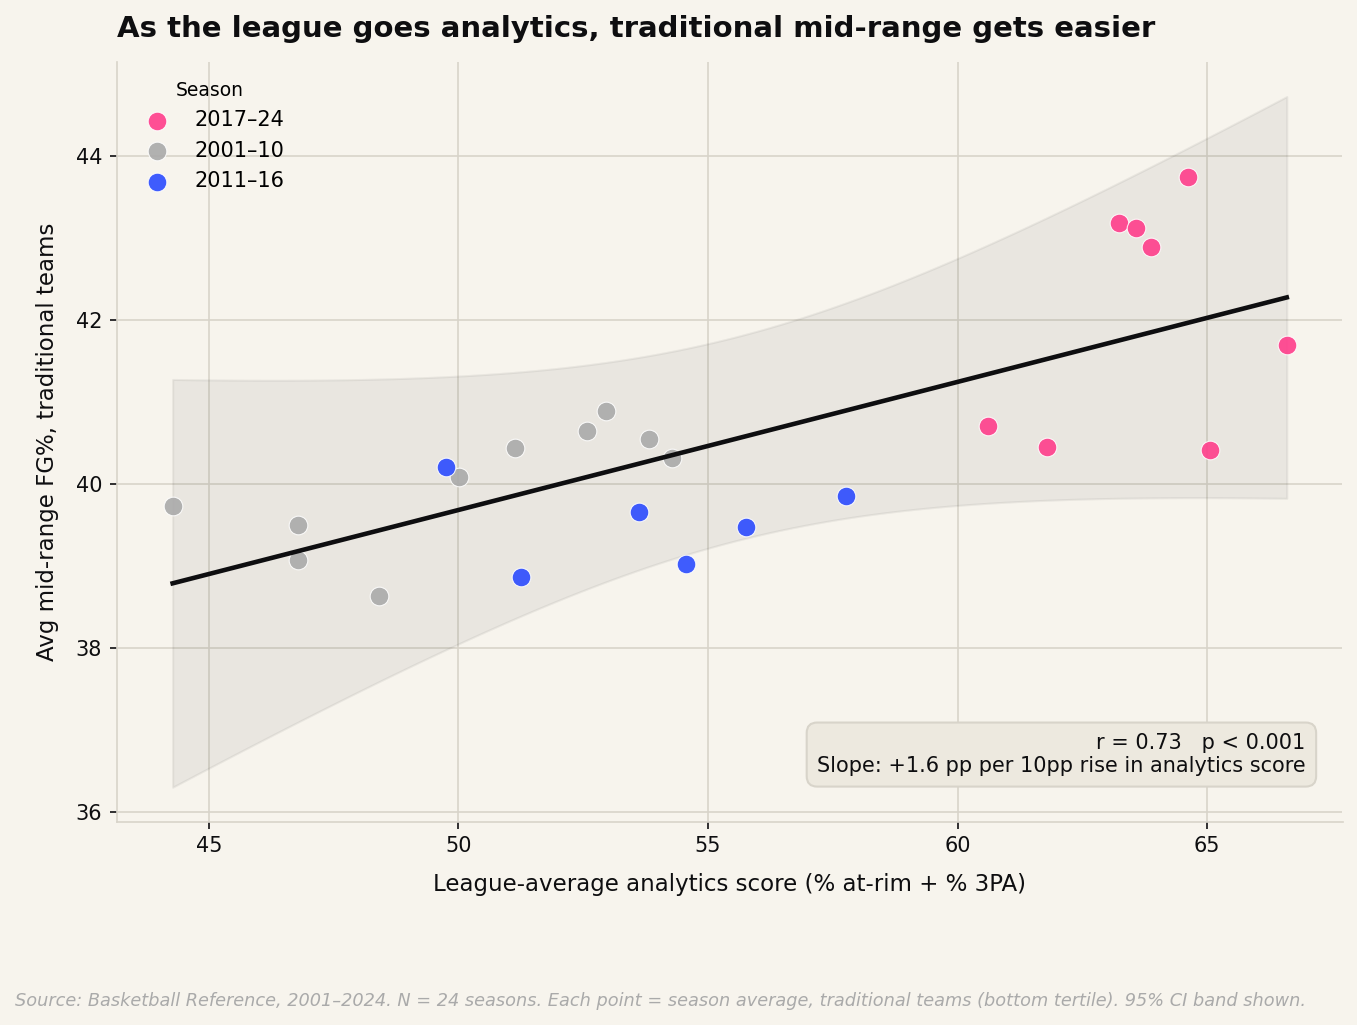
The direct version of the spillover hypothesis is a regression: does the league's average analytics score in a given season predict how well traditional teams shoot from mid-range that year? At the season level (N = 24), the correlation is r = 0.73, p < 0.001, with a slope implying roughly 1.6 percentage points of mid-range efficiency improvement per 10 percentage point rise in league-wide analytics adoption. Running the same regression at the team-season level with standard errors clustered by season gives consistent results.
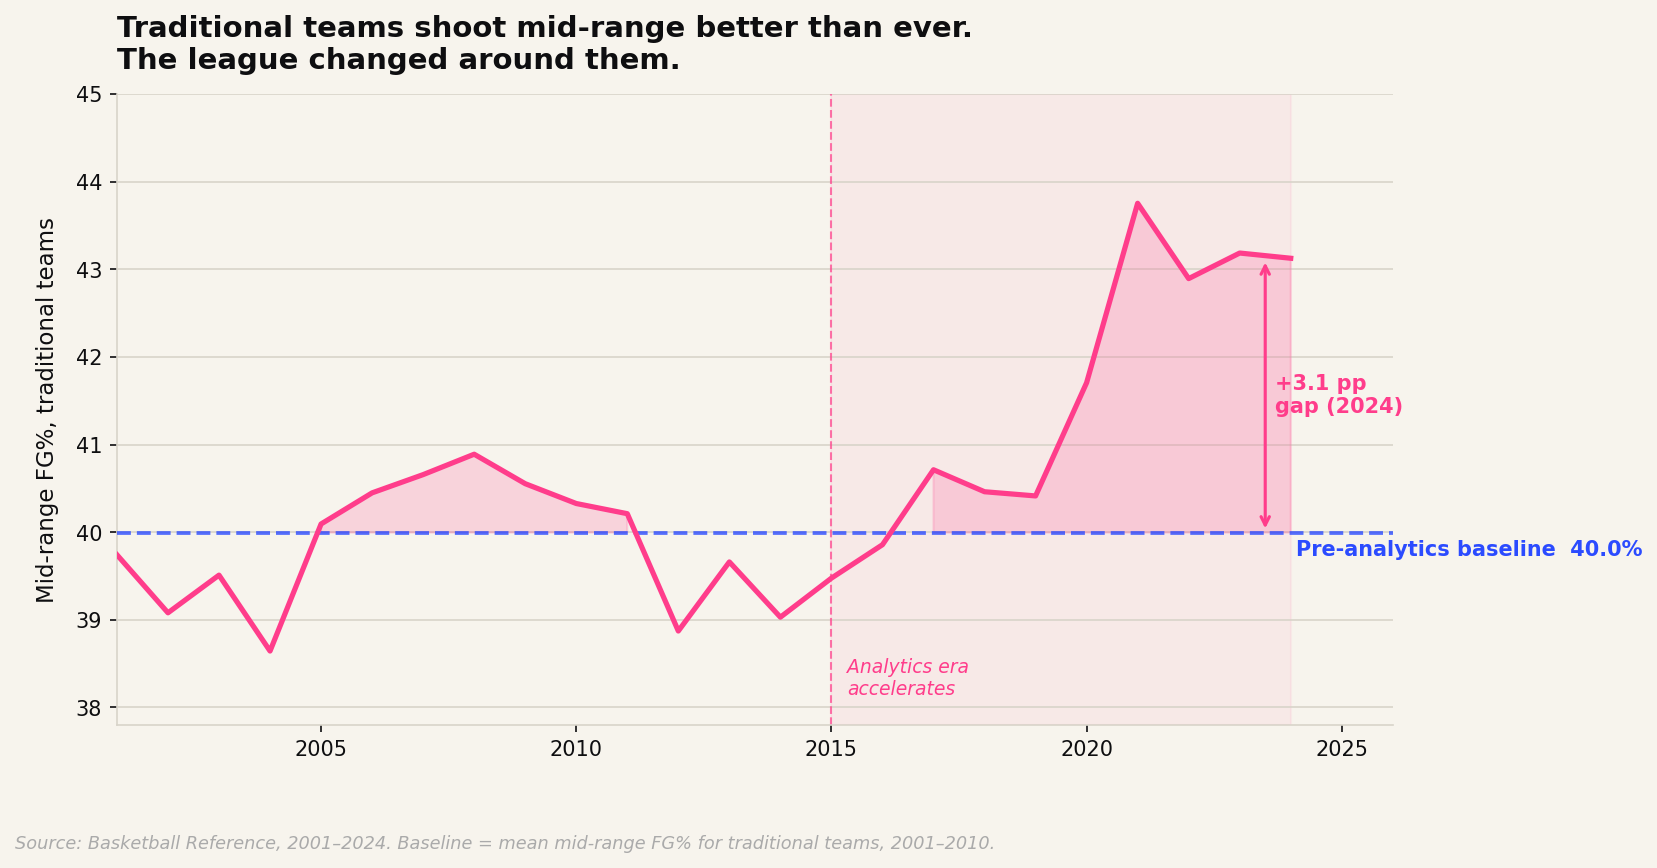
Against a 2001-2010 baseline of 40.0%, traditional teams were shooting 43.1% from mid-range in 2024, a 3.1 percentage point gap that the model estimates could be largely explained by the observed shift in league shot selection.
Two confounders are worth being honest about. The NBA eliminated hand-checking and tightened the defensive three-second rule in 2004-05, changes that broadly opened up perimeter shooting and coincide with early analytics adoption. The spillover story and the rules story are not separable with this data, and some portion of the efficiency gain probably reflects the rule change. Players in 2024 may also simply be better shooters than players in 2001 across all shot zones. That, too, I cannot rule out.
What remains is a correlation that is robust to specification, consistent with the proposed mechanism, and not easily explained by coincidence alone, without being proof of anything in particular. The spillover explanation is the most coherent one I have for the pattern; it is not the only possible one.
The Jeunen paper is making a point about A/B tests in tech, but the structure generalizes. When competing strategies are not truly independent, whether they share a training environment, a market, or a defensive scheme, the measured performance of each reflects the mixed environment, not what either would do in isolation. If every NBA team adopted analytics shot selection simultaneously, the defensive adaptation that currently benefits traditional teams would reverse. The mid-range would get harder. The measured advantage of staying traditional is a function of who else is exploring, and it disappears when the explorers do. Measuring performance in a mixed environment and treating the result as universal is how spillover effects get misread as genuine capability.
Data: Basketball Reference, team shooting by zone, 2001-2024. N = 716 team-seasons. Analytics score = (% FGA at rim 0-3 ft) + (% FGA as 3-pointers). Mid-range = shots from 10 ft to the arc. Teams classified into tertiles annually within each season. Season-level regression N = 24; team-season clustered SEs give consistent results. Code available on request.
Paper: Jeunen, O. "A Common Misassumption in Online Experiments with Machine Learning Models." ACM SIGIR Forum, working draft, 2024.