In 1979, bachelor's degree men earned about 23% more than men with high school diplomas, a modest premium by today's standards. That year, about 77% of college-educated women and 79% of women without degrees were married by age 45. The two groups looked nearly identical on both counts.
By the 1980 birth cohort, both of those facts had changed substantially. A recent NBER working paper by Chambers, Goldman, and Winkelmann documents what shifted in the marriage market between those two points.
The story starts with colleges. In the 1930s there were roughly 1.8 college men for every college woman. By 1980 that ratio had inverted to 0.8. Women now outnumber men on four-year campuses by 1.6 million, and the gap is still widening. You would expect this to reduce college women's marriage rates, given fewer similarly educated partners available. It mostly didn't.
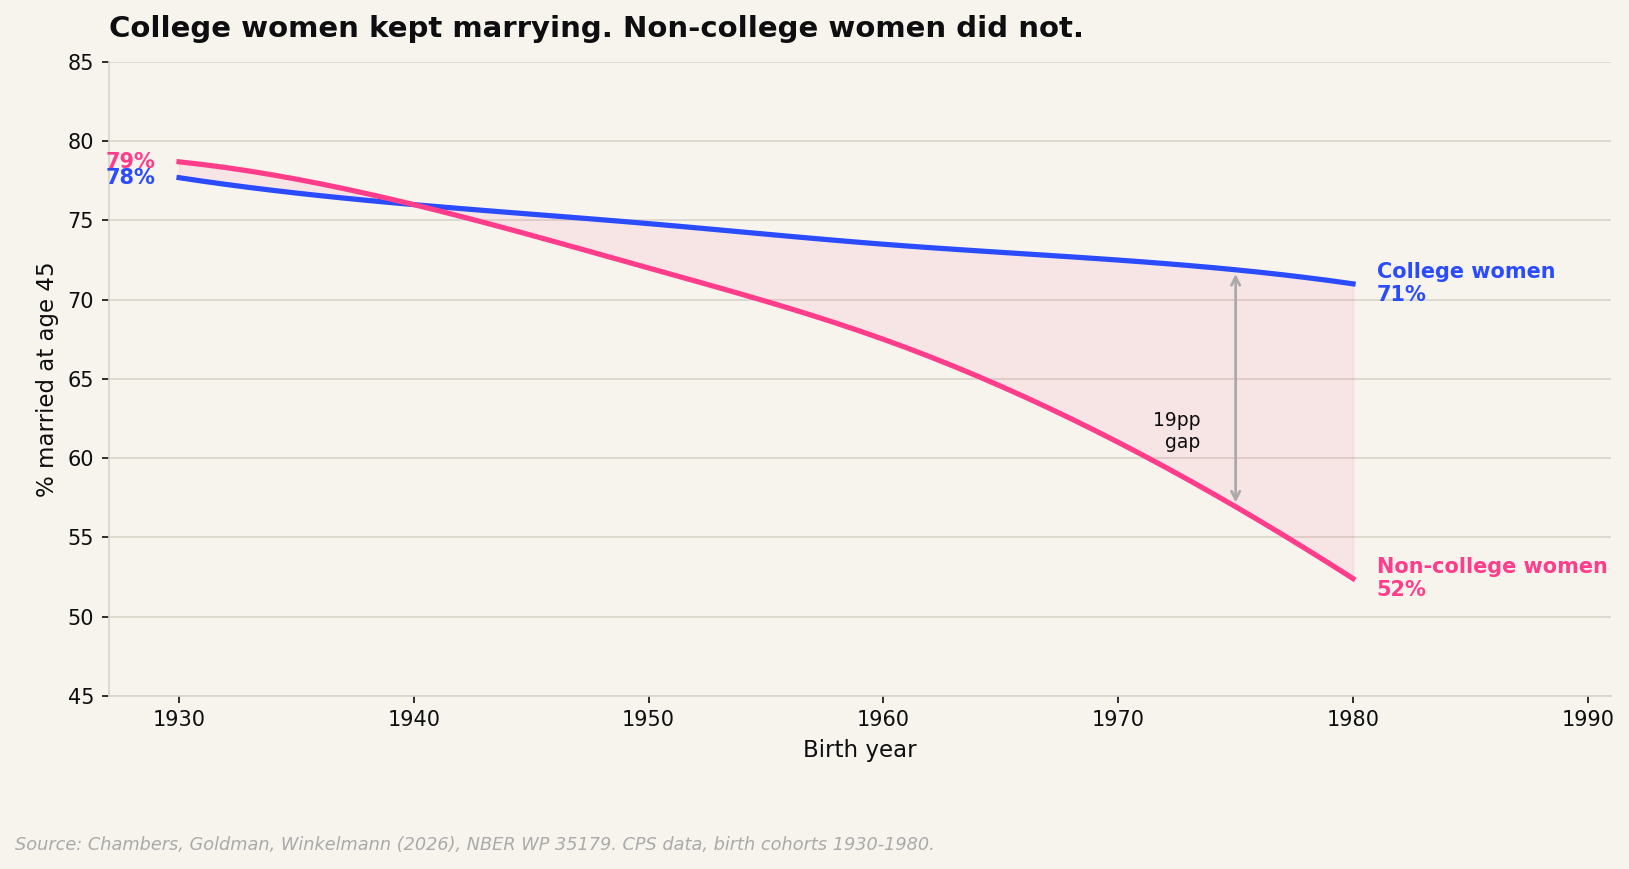
College women's marriage rate at age 45 fell from 78% to 71% across cohorts born between 1930 and 1980, a real decline, but modest. Non-college women went from 79% to 52%. The two groups started at essentially identical rates and ended 19 percentage points apart.
The question the paper asks is: where did the effect go? College women faced a shrinking pool of college men. Why didn't their marriage rates fall further?
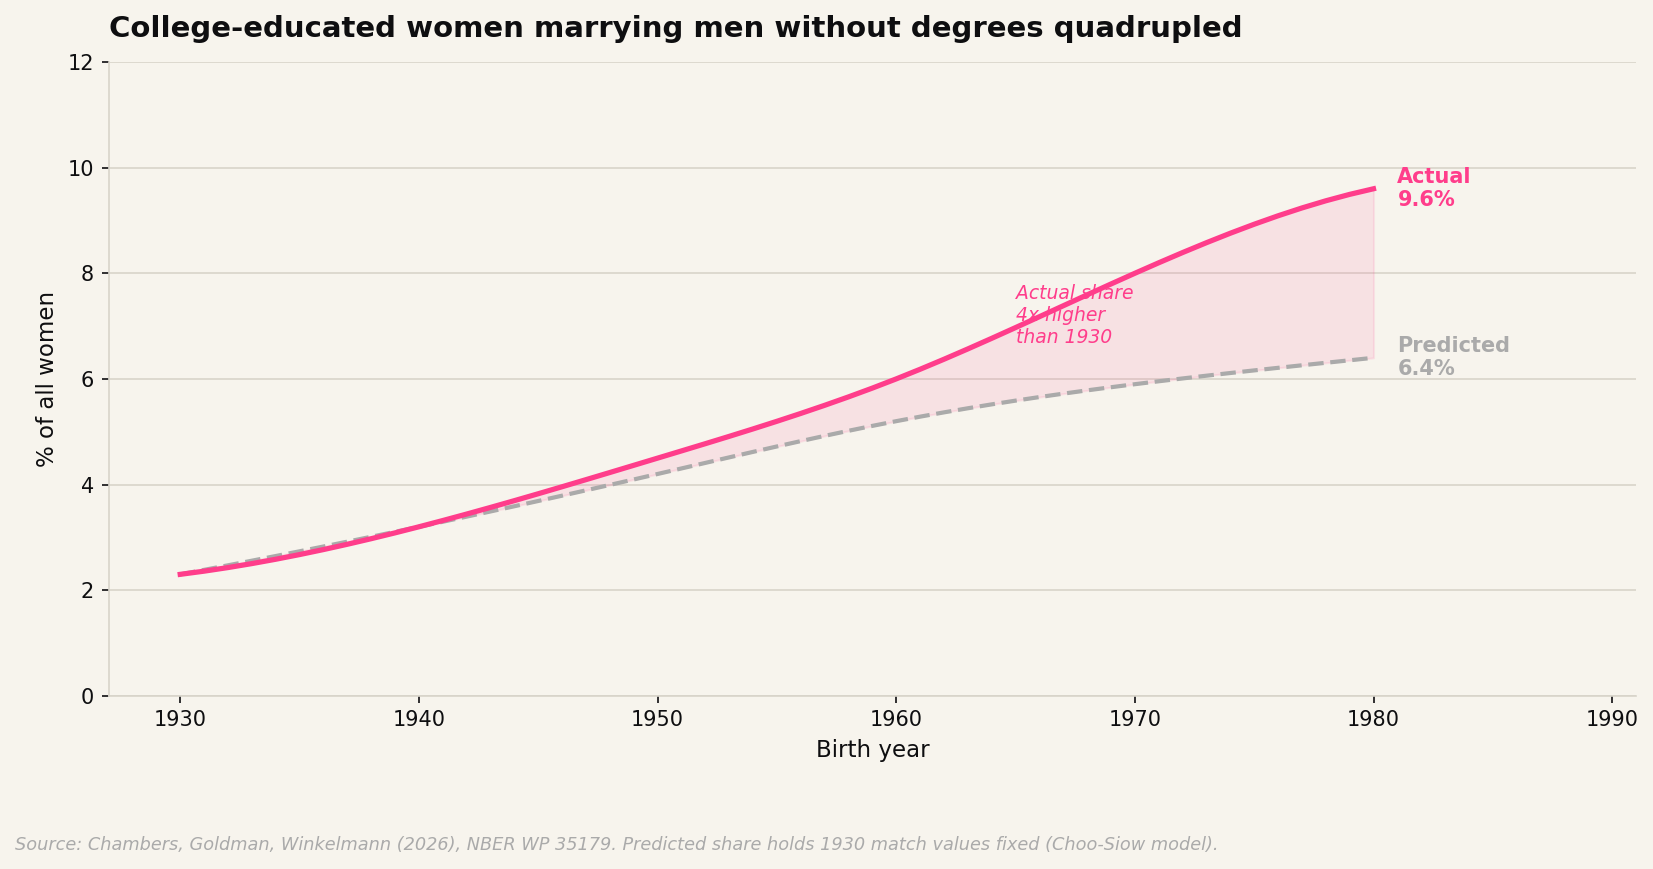
The paper's answer: college women increasingly matched with high-earning men without degrees, men who, in earlier generations, had formed the core of the non-college marriage market. The share of all women who are college-educated and married to a non-college man quadrupled over the fifty-year period, from 2.3% to 9.6%. The paper uses a marriage market model to show that this shift went well beyond what you'd expect from changing group sizes alone. It reflects a change in matching patterns.
The earnings data shows the selection was concentrated at the top of the non-college earnings distribution. Non-college men who married college women saw their real earnings rise over time, from $61,400 to $68,400 at age 45. Non-college men who married non-college women saw theirs fall, from $56,400 to $46,100, consistent with the highest earners in that group being matched elsewhere.
The effect on the non-college marriage market is easiest to see through a metric the paper constructs: the share of non-college men who earn above the national median and are not already in a cross-education marriage. In 1930, that number was 72.9%. By 1980, it was 35.3%.
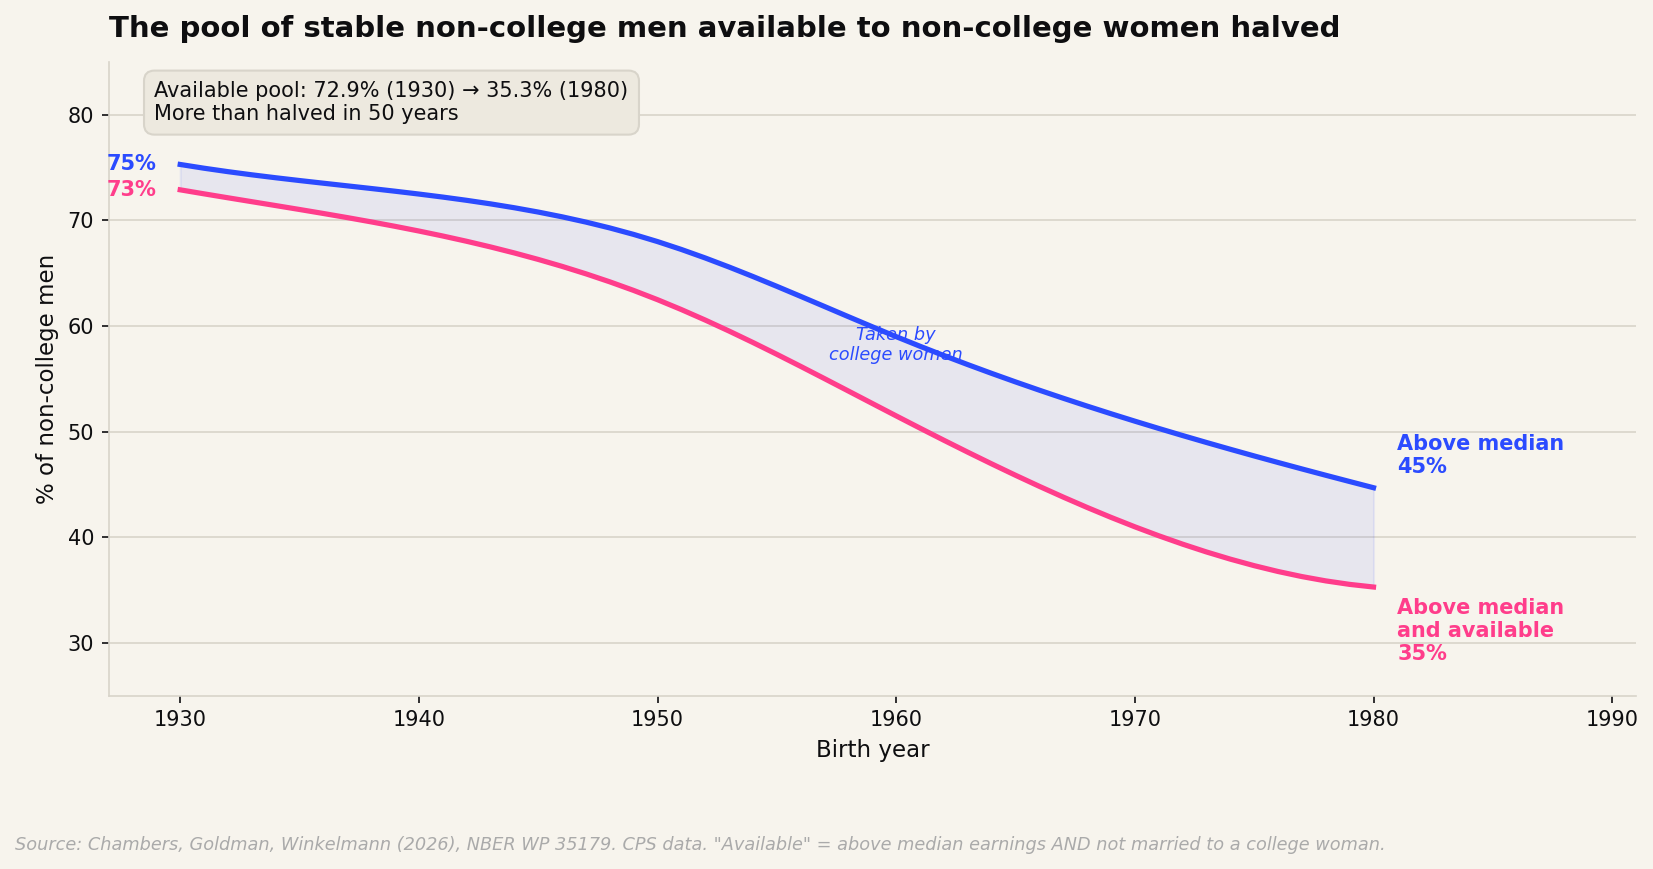
Both channels are visible in the chart. The top line shows the share of non-college men who earn above the median. That fell too, from 75% to 45%, as the labor market position of men without degrees eroded over the period. The bottom line subtracts those in cross-education marriages. The gap between the two lines is the matching shift; the decline of the top line is the labor market decline. The two effects compound.
The labor market piece has continued to widen since the paper's sample period ends. In 1979, the college earnings premium for men was 23%. By 2024 it was over 90%.
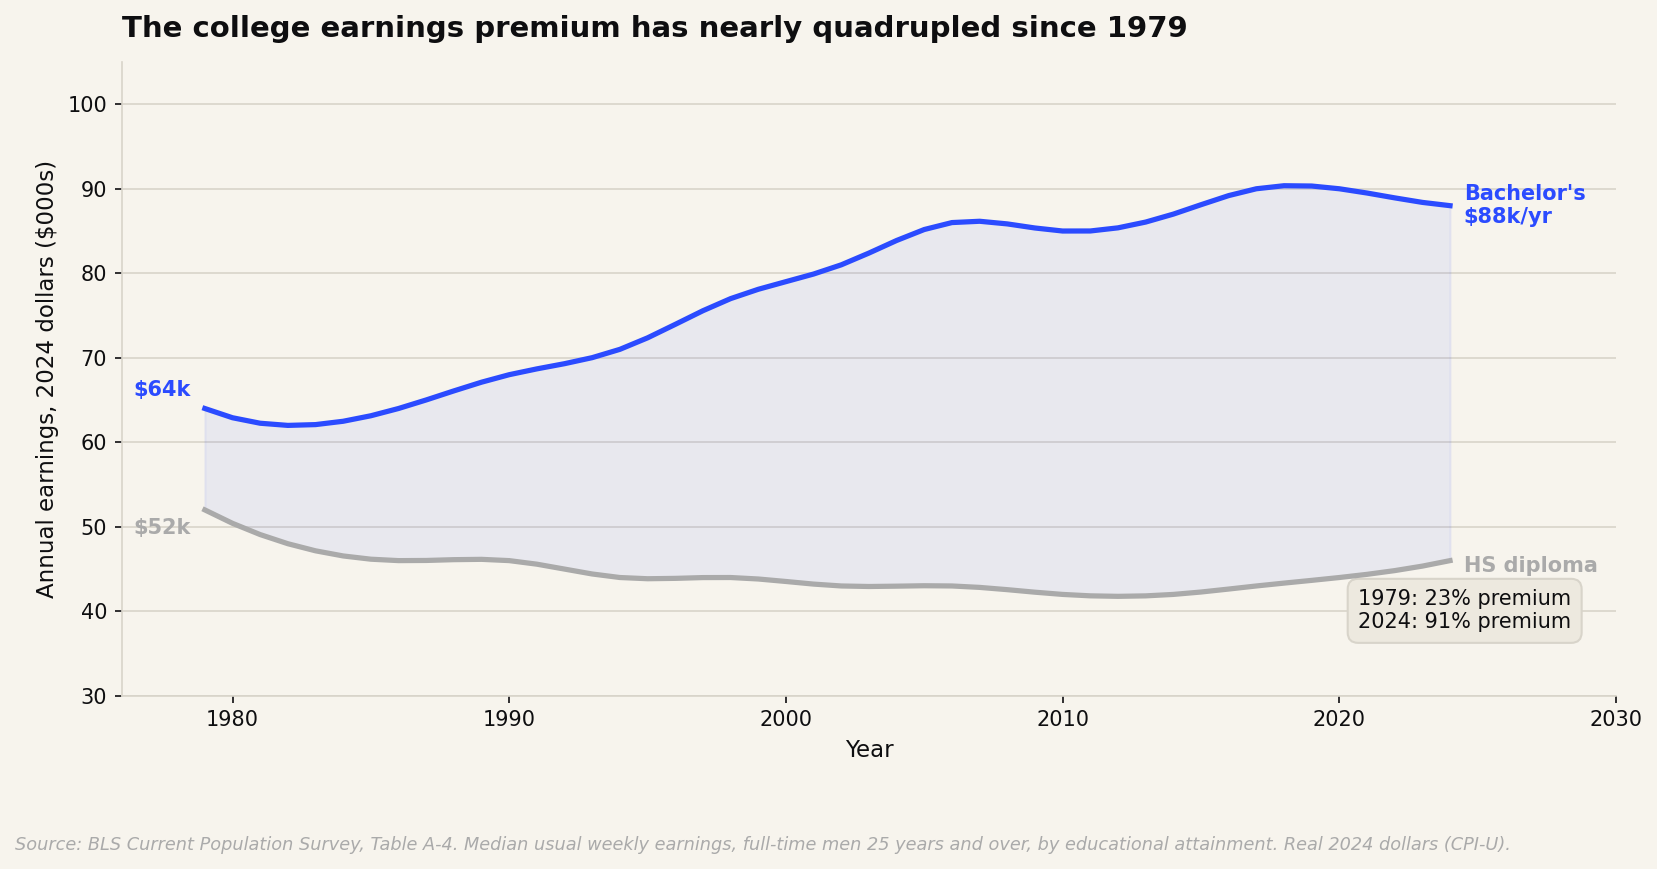
High school diploma men's real annual earnings fell from roughly $52k to $46k (2024 dollars) between 1979 and today. Bachelor's men went from $64k to $88k. The marriage market patterns the paper documents are partially a reflection of the labor market: as earnings became more concentrated among degree-holders, matching patterns shifted accordingly.
The paper also runs the analysis geographically. In areas where non-college men have high employment rates and low incarceration rates, the marriage rate gap between college and non-college women nearly closes. In areas where non-college men's economic position is weaker, the gap reaches almost 18 percentage points. The geographic variation tracks specific economic outcomes for men more closely than it tracks cultural proxies.
The mechanism the paper argues is consistent with the data is a market externality: as matching patterns shifted in response to the college gender gap, the composition of who was available in the non-college marriage market changed. The paper is careful to say the observed patterns "correspond with" these demographic and economic shifts rather than claiming they definitively caused them.
There is also a prior question the paper cannot answer: how much of the observed decline in marriage rates reflects constrained supply versus changing preferences. Both produce the same pattern in the data. A woman who does not marry because fewer economically stable partners are available looks identical in the statistics to a woman who does not marry because she prefers not to. The paper documents the supply side. It does not, and cannot, establish that declining marriage rates represent an outcome people would change if supply constraints were removed.
The authors explicitly acknowledge that changing social norms, women's own earnings, labor-force participation, tax policy, and other factors may also contribute to the observed patterns. Their model estimates what they call marital surplus, which bundles these influences together rather than isolating each one. What it can show is that the observed matching patterns are consistent with changing incentives and demographics. What it cannot show is exactly why preferences or behavior shifted when they did, or how much of the change reflects economics versus culture versus something else entirely.
Paper: Chambers, C., Goldman, B., and Winkelmann, J. "Bachelors Without Bachelor's: Gender Gaps in Education and Declining Marriage Rates." NBER Working Paper No. 35179, May 2026. Invited for revision at Nature Communications.
Marriage rate data from paper's figures (CPS, birth cohorts 1930-1980). Earnings data: BLS Current Population Survey Table A-4, median usual weekly earnings of full-time workers, men 25 years and over, by educational attainment; real 2024 dollars (CPI-U). Author calculations.