There is a chart I return to. The way one returns to a difficult letter, not because it gets easier, but because it refuses to be ignored.
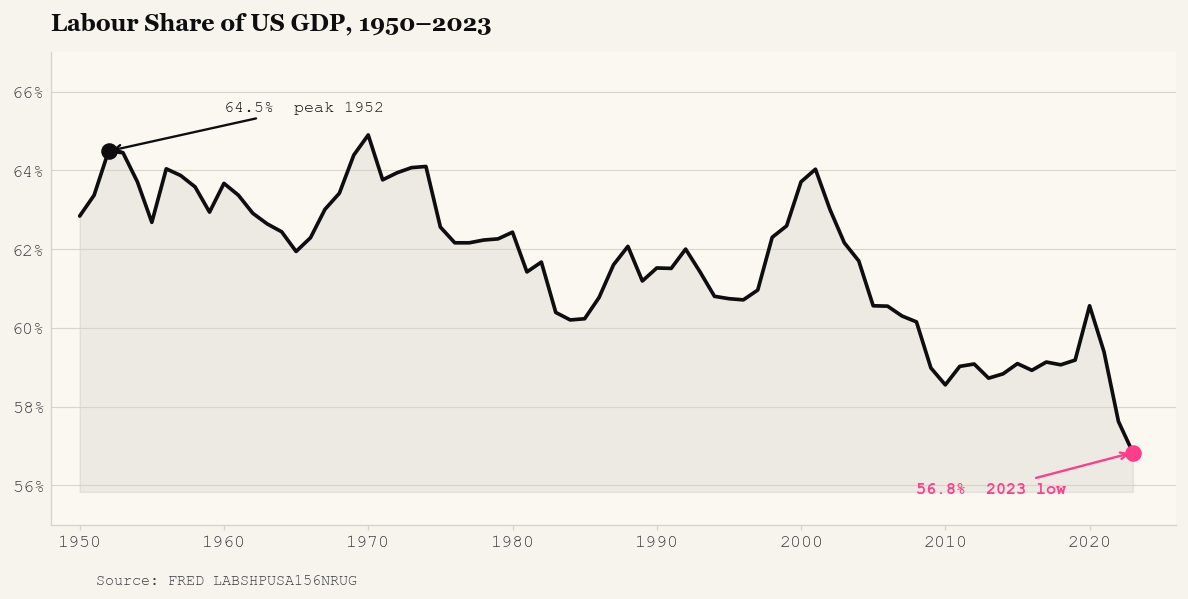
It covers seventy-three years and a single question: of every dollar this economy produces, what fraction goes to the people who did the work? The answer, in 1952, was 64.5 cents. In 2023, it was 56.8 cents.
Seven cents. That is what seventy years of productivity growth, technological revolution, and the largest expansion of human capacity in recorded history delivered to the people who showed up.
The decline is not noise. It is structural and multi-causal. It also has a second act that does not appear in the labour share chart at all, and that second act is doing more damage than the first.
The arrangement that wasn't written down
Every economy has, beneath its statutes and regulations, an implicit arrangement. An understanding about how the proceeds of collective effort will be shared. The postwar American version was, by historical standards, quite generous to labour: union density above thirty percent, a minimum wage that tracked productivity, and a tax code that treated a dollar of wages and a dollar of dividends with something approaching equal suspicion.
I won't romanticise it. The arrangement excluded a great many people, as arrangements of that era tended to do. But for those inside it, the deal was clear: work harder, earn more. The economy grows, wages grow with it.
That arrangement did not end with a scandal. There was no single villain, no decisive vote, no moment you can point to and say there. It dissolved the way old estates are lost, not in one catastrophic sale, but through a long series of quite sensible individual decisions that add up, in retrospect, to ruin.
The 1980s deregulated financial markets and raised the real return on capital, just as unions lost their grip on private-sector bargaining. The 1990s brought cheap imports and cheaper capital goods simultaneously, raising the attractiveness of machinery over workers on two axes at once. The 2000s handed capital a tax cut and dealt labour a trade shock, in the same decade. By the time economists had a paper documenting what happened, the arrangement had already been renegotiated. Unilaterally. Quietly. In a thousand separate boardrooms. The new terms were simply the terms.
The r-g problem
In Capital in the Twenty-First Century, Thomas Piketty formalised what the data had been signalling for decades. When the return on capital (r) persistently exceeds the rate of economic growth (g), capital accumulates relative to labour income as a matter of arithmetic. The capital-to-income ratio rises. More total income flows to owners. Labour's share falls.
The mechanism is not complicated. When your money grows faster than the economy, you accumulate more of it relative to everyone else. When enough capital accumulates, the income it generates, dividends, rents, royalties, interest, begins to crowd out the income from work. Labour does not necessarily earn less in absolute terms. It simply earns a smaller fraction of a growing pie.
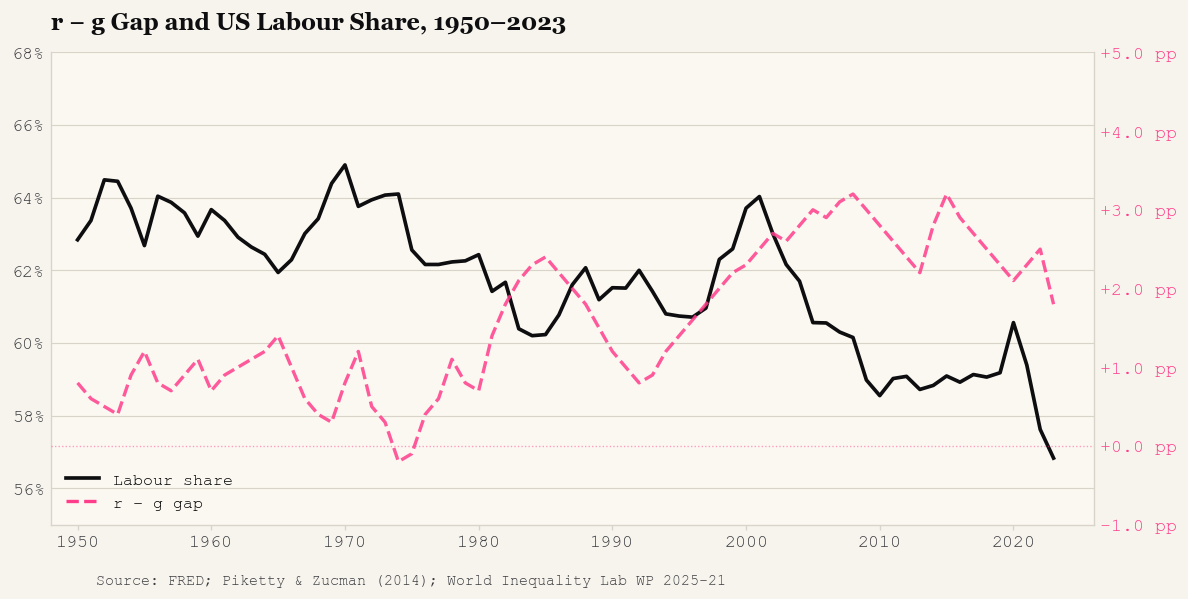
I constructed an annual r-g series using real GDP growth from FRED (5-year centred moving average) and net return on capital calibrated from Piketty and Zucman (2014) and the World Inequality Lab's 2025 update. I applied a 2-year lag to account for adjustment dynamics. The r-g series is an approximation, the true return on capital is unobservable in real time, but it tracks the structural shifts well.
The Pearson correlation between the r-g gap and the US labour share is -0.731 (p < 0.001, n = 60).
That is not a weak association. That is the kind of number that makes a statistician put down their fork.
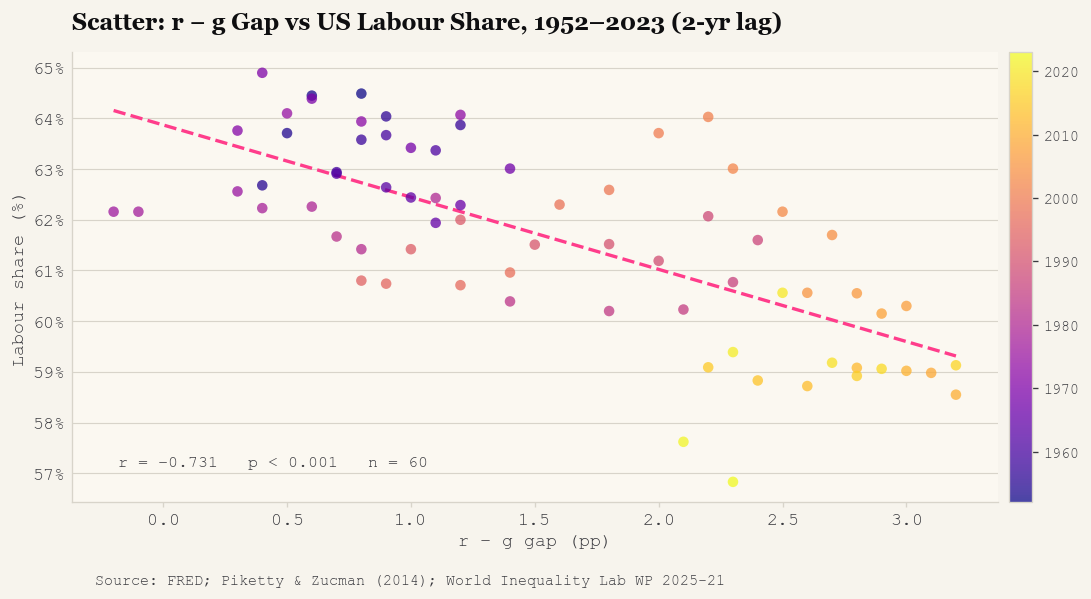
The slope implies that a one-percentage-point increase in the r-g gap is associated with a 1.2-point decline in the labour share over the following two years. This is stronger than the -0.45 typically reported in cross-country studies, because those panels include countries where stronger labour institutions dampen the effect, pulling the pooled estimate toward zero.
The tax code chooses sides
Here is what I find when I look at the tax code without sentiment.
It charges labour income at a top rate of 37 percent. Include payroll taxes, paid partly by the employee, partly by the employer, but ultimately priced into the labour bargain, and the effective rate on high-wage earners reaches 52.3 percent. Capital gains, meanwhile, are taxed at 23.8 percent.
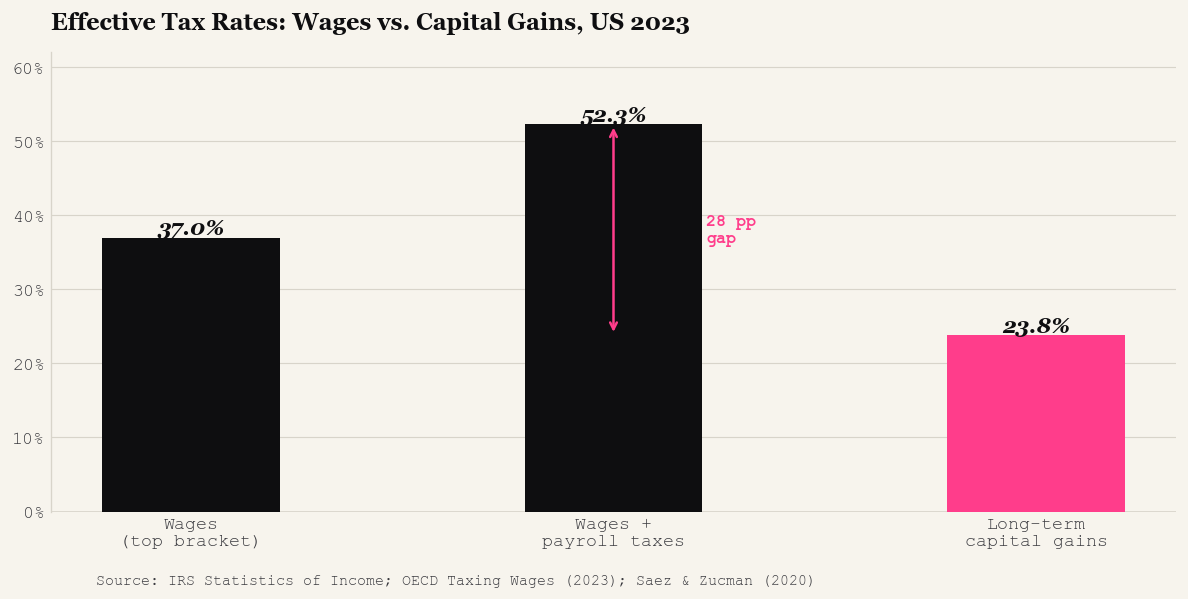
Twenty-eight points. A dollar earned by working is taxed at more than twice the rate of a dollar earned by owning.
This is not an oversight. Tax codes are not written in haste. The differential reflects a theory: capital is mobile and must be coaxed with favourable treatment, while labour is stationary and can bear a heavier load. You might find the theory plausible. It is worth asking, though, whether this is precisely what anyone intended.
The gap widened materially after the 2003 Bush tax cuts and again after the 2017 Tax Cuts and Jobs Act. The US spread of 13 to 28 points sits well above the OECD average of approximately 10. Every additional point is, in effect, a subsidy to capital accumulation, the same process that inflates the assets workers are trying to buy.
Automation
Industrial robot density, a proxy for capital substituting for labour in production, has risen roughly fourfold since 1993.
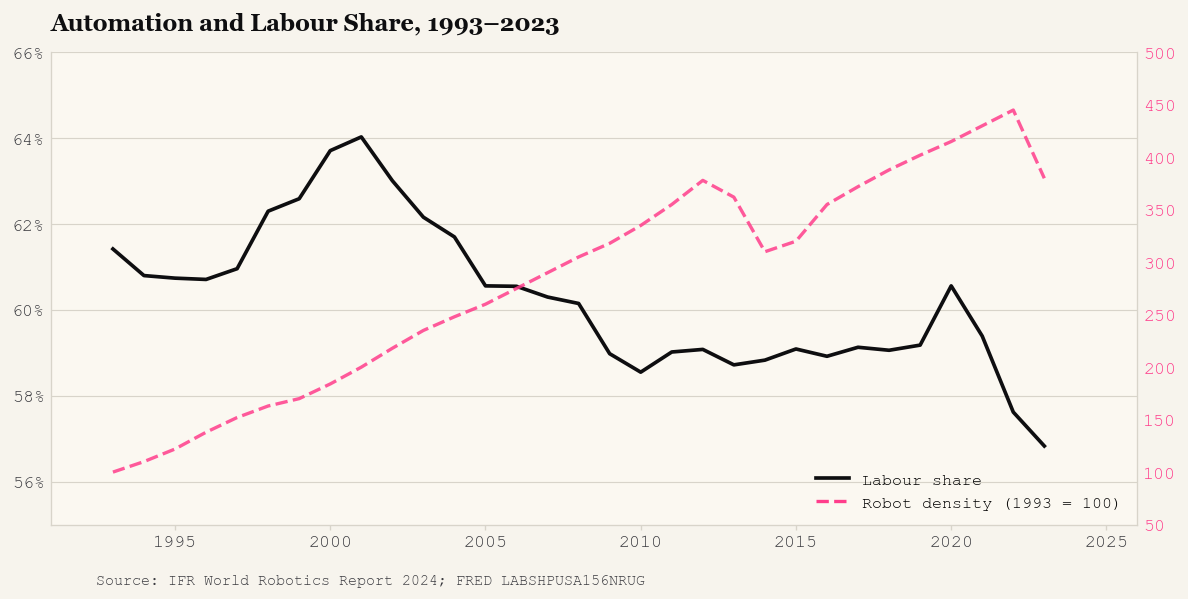
The correlation with the labour share runs at approximately -0.68 over that period. Acemoglu and Restrepo (2022) estimate that one additional robot per 1,000 workers reduces the local labour share by 0.3 percentage points. The effect is concentrated in routine manual tasks, the same occupations hit by import competition from China, suggesting the forces are complementary, not competing explanations.
Robot density alone does not fully explain the trend. It is weaker than the r-g correlation. But the two are connected: cheaper capital goods raise the capital stock, which widens r-g and compresses the labour share through the Piketty mechanism. Each force amplifies the others. This is why single-variable explanations, it's just China, it's just robots, it's just unions, systematically undercount the total damage.
The next wave targets white-collar service workers. Goldman Sachs (2024) estimates generative AI could automate 25 to 30 percent of current US work tasks. If the institutional response resembles what happened with manufacturing automation, decentralised, market-determined, with minimal redistributive counterweight, the labour share will keep falling.
The asset price trap
Here is the part of the story the labour share chart does not show.
When r persistently exceeds g, capital compounds faster than the economy grows. That accumulating wealth has to go somewhere. It flows into assets: housing, equities, land, anything that produces a return. As more capital chases a finite stock of productive assets, prices rise. Not because the assets improved. Because the return on capital is high enough to justify paying more for future income streams.
The result is a feedback loop with a particularly cruel property: the same force that compresses wages also inflates the price of every asset workers need to buy in order to build wealth.A worker earning median wages in 1975 could afford the median home in roughly four years of income. Today, that ratio in many major markets exceeds ten years. The house did not get ten times better. The labour share fell, capital accumulated, and the capitalised value of housing rose to reflect returns that wages simply cannot match.
Canada makes this point sharply. Its labour share sits 5 to 8 points above the US, the product of stronger unions, higher minimum wages, and a narrower tax differential.
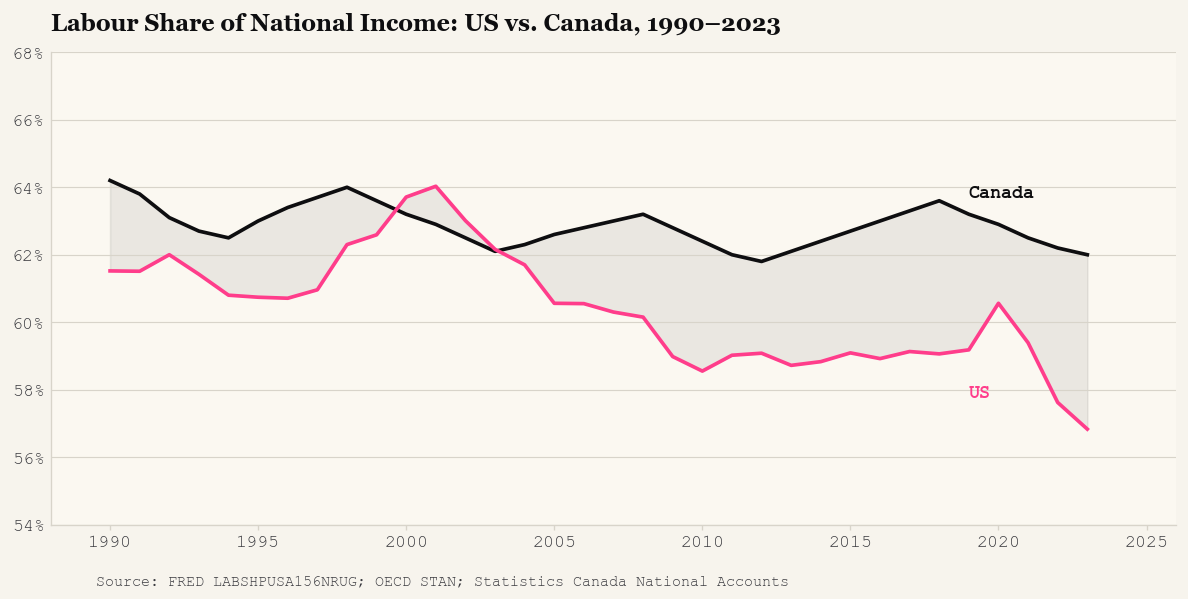
And yet Canadian youth face arguably the worst housing affordability crisis in the developed world. Vancouver and Toronto consistently rank among the least affordable cities globally. Canada's under-35 homeownership rate has collapsed. A generation earning a higher labour share than their US counterparts still cannot afford to enter the asset markets that generate the returns.
A higher labour share is necessary. It is not sufficient. If r still exceeds g by a wide enough margin, capital will find ways to inflate asset prices beyond what wages can reach, regardless of what fraction of GDP those wages represent. The labour share chart measures what workers earn. It does not measure the growing cost of everything workers need to own in order to stop depending on wages.
This is the deeper mechanism: r > g does not just tilt the income distribution. It tilts the entry price to the wealth distribution. Every cohort priced out of housing, equities, or productive capital starts further behind the compound-interest curve than the one before it. The gap does not close. It compounds.
What the 56.8 means
Fifty-six point eight percent.
Of every dollar the US economy produced in 2023, 56.8 cents went to the people who worked in it. The remaining 43.2 cents went to capital: shareholders, landlords, holders of intellectual property and financial assets.
In 1952, the split was 64.5 to 35.5.
The additional 7.7 cents per dollar that capital captured over those seventy years, compounded across a $27 trillion economy, is an enormous quantity of money. It did not vanish. It went into portfolios that compound at r, which exceeds g, which is the whole problem.
None of this required malice. It required only the slow disappearance of the countervailing forces that once kept the arrangement in place: union density, wage floors, tax parity, political will.
The uncomfortable conclusion is that fixing the labour share alone may not be enough. If capital returns still exceed growth, asset prices will still compound faster than wages. A future generation with a 64 percent labour share and a 15x price-to-income ratio on housing is not obviously better off than workers today.
The problem is not only that labour earns less. It is that capital has become expensive enough to price out the people who produce it, ensuring that the next generation starts the race further back. That is a different policy challenge than wage floors and union density. It requires directly taxing the returns to capital, or redistributing productive assets themselves, in ways that most political systems have shown very limited appetite for.
What comes next depends on whether those countervailing forces are rebuilt. The data is clear on what happens if they are not.
Data: FRED LABSHPUSA156NRUG; WIL Working Paper 2025-21; OECD STAN; IFR World Robotics Report 2024. Full references in the research report.